Marvis
Roaming History Visualization
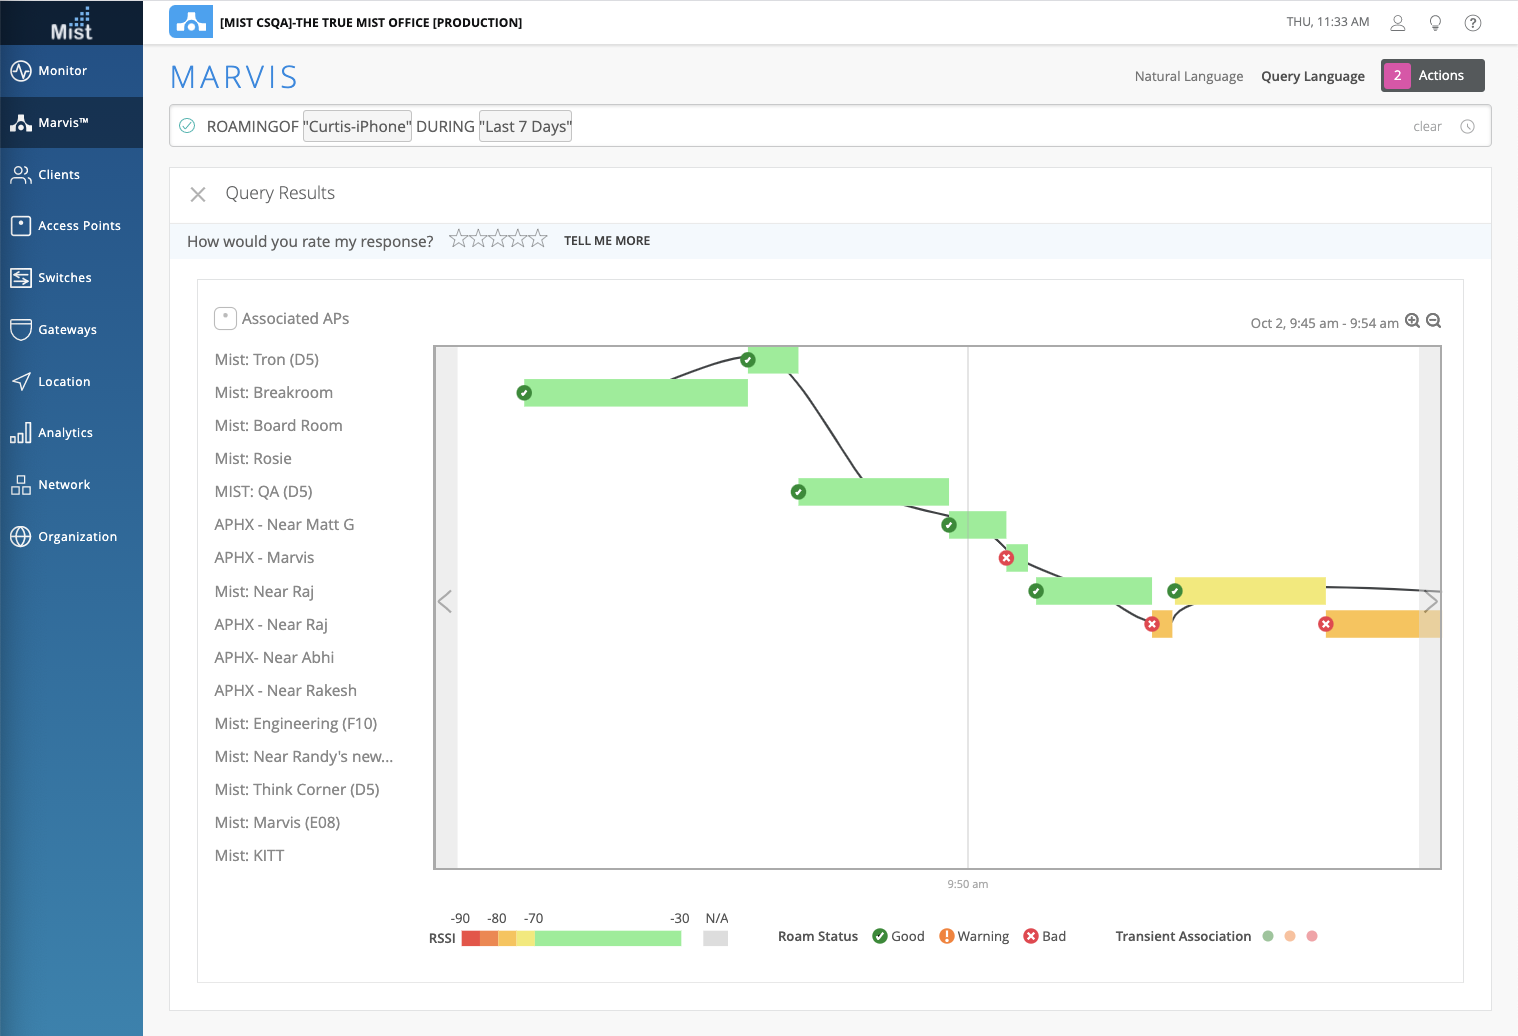
We are very excited to bring you an entirely new visualization to track the roaming paths of your clients! With our new Roaming of <CLIENT> query in the Marvis search, you can see a timeline view of your client roaming between different APs. We use the data from the Client Events and arrange it in an easy way to visualize the path your client takes. With this roaming visualization, you can also see details such as the RSSI data while associated to an AP, as well as the Roam Status while associating. Bad roam statuses are marked when the RSSI is low, and a warning roam status occurs when the client jumps to a different radio band or WLAN during the roam.

The dots you see on here are called Transient Associations, which are simply just short interval associations with the AP. You may zoom in on the chart to get a more detailed view of the roaming during transient associations. Either use the + and – buttons on the top right of the timeline, or click and drag your cursor to zoom in on a specific time window. Here, we zoomed in on the row of transient associations in the 9:45am – 9:54am time range
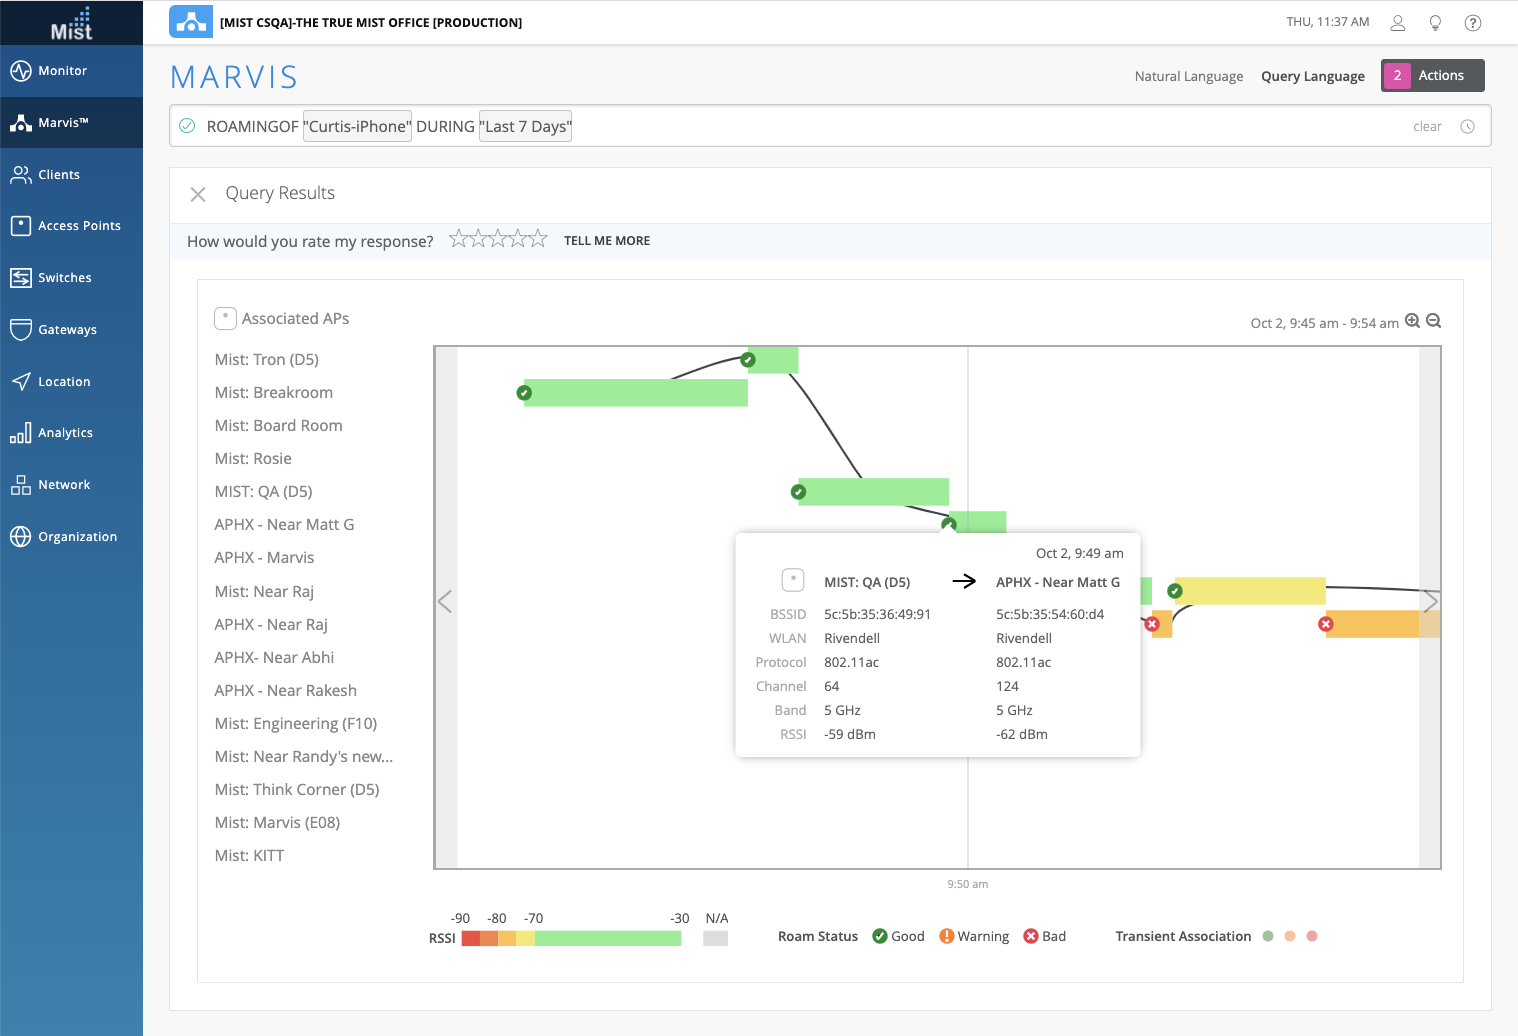
Hover over the roam status icons on the timeline to view detailed information about the roam, such as the channel, band, and RSSI information. We can see that at 9:49am the client experienced a good roam between the APs:
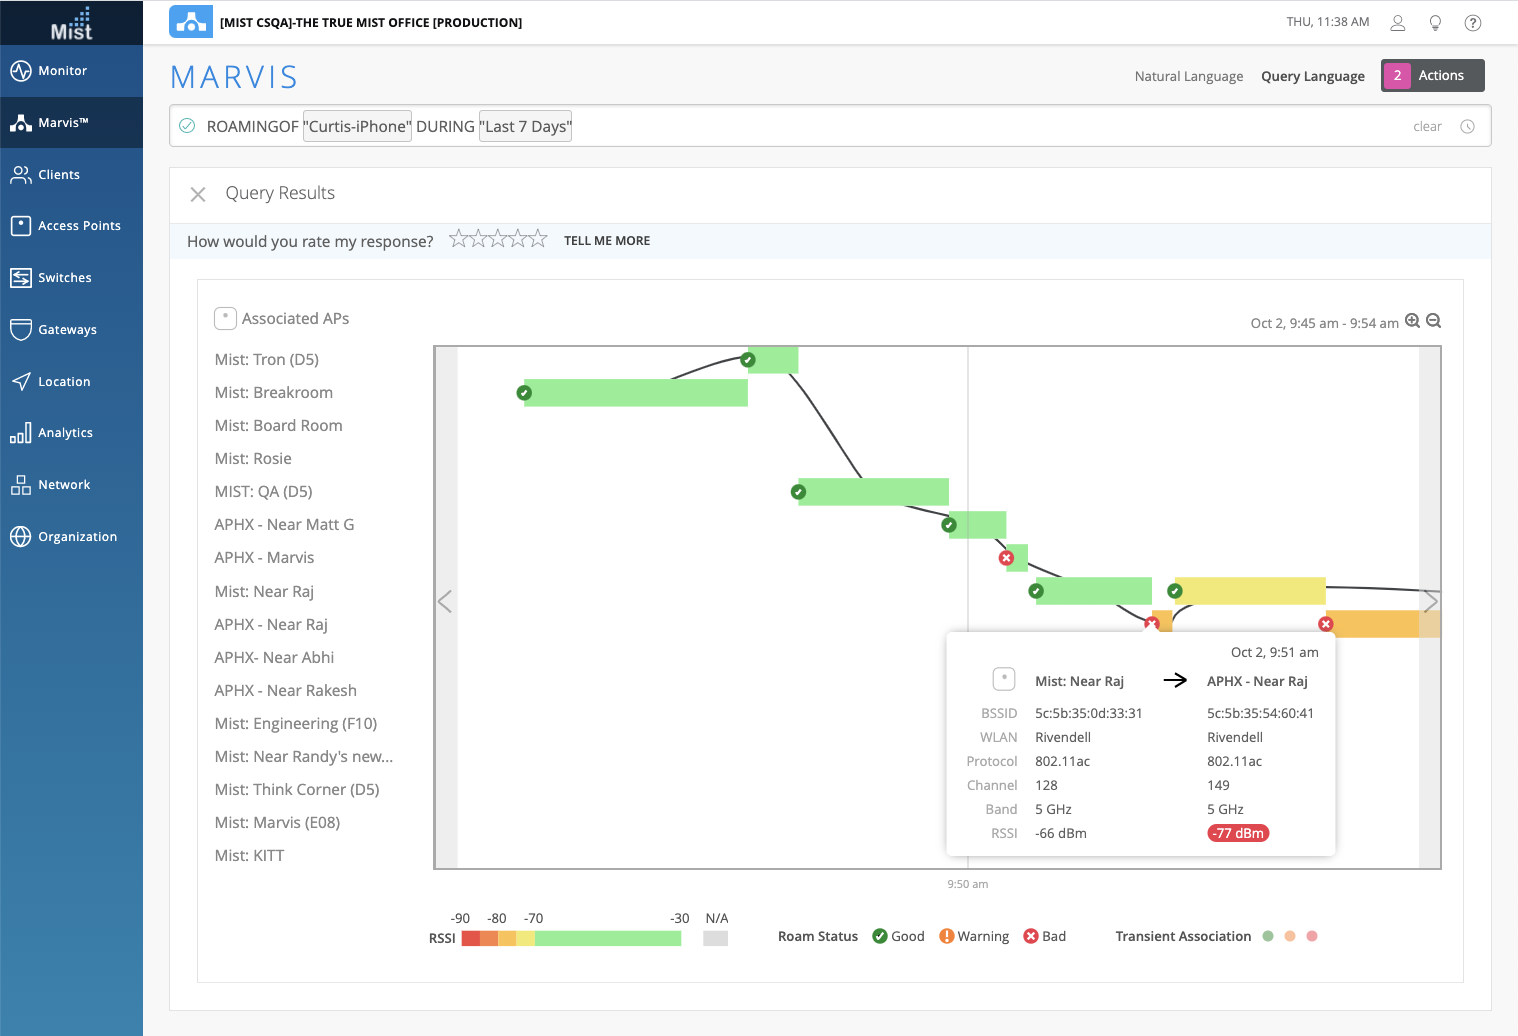
A bad roam occurred here. Notice that we will indicate a low RSSI for these bad roam statuses:
Here, the client switched from the 5GHz radio band to the 2.4GHz band during its roam, so the roam status shows as warning.
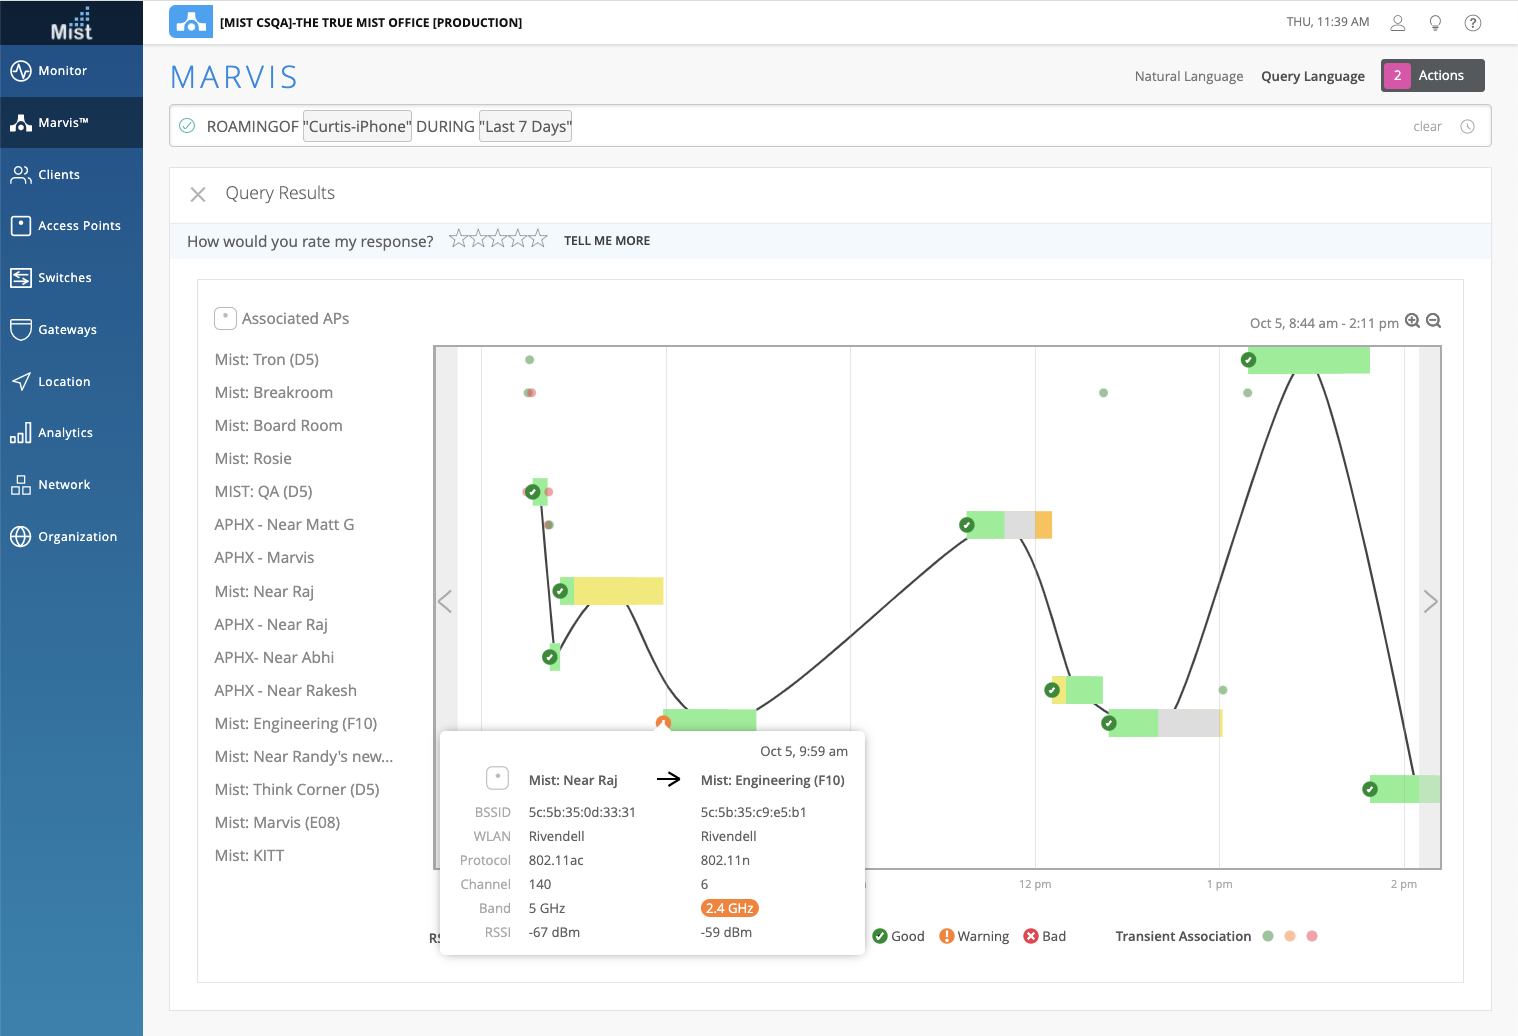
The Marvis search for roaming works in both Natural Language and Query Language mode, and you may also specify the time range in your search as well.
Network Programmability
RADIUS Interim Accounting
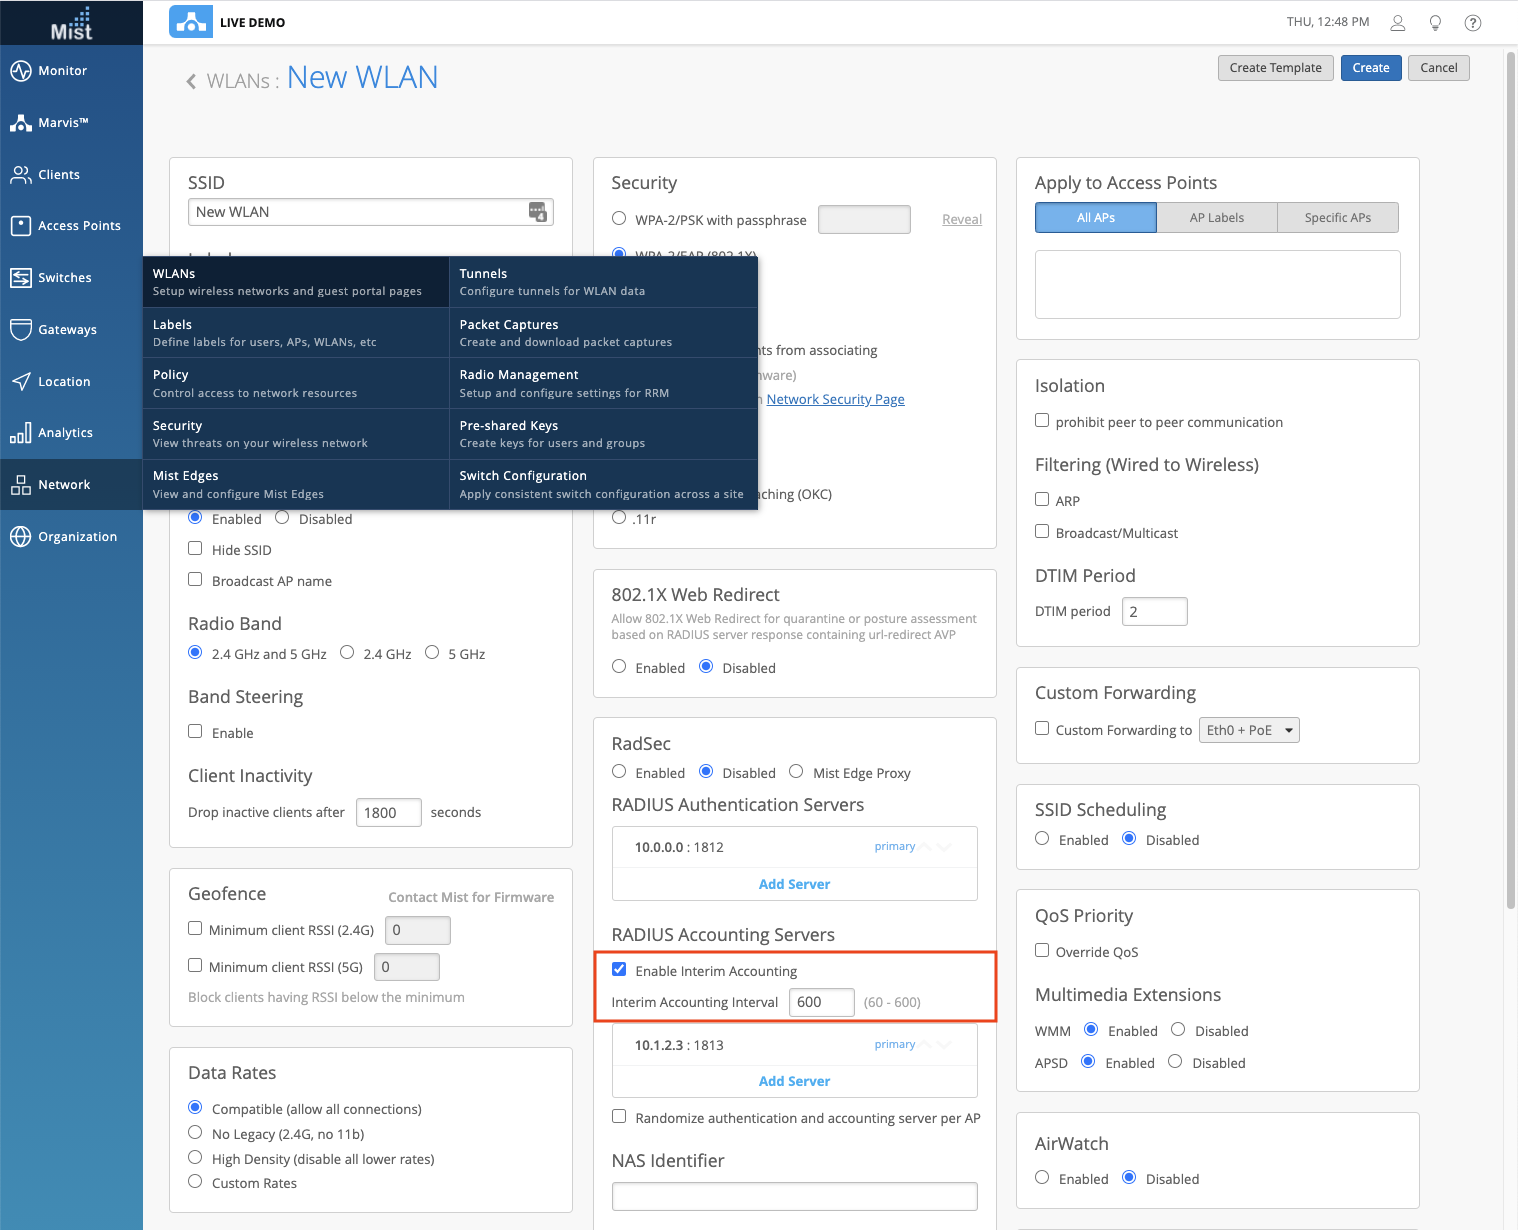
Starting this week, we are bringing the RADIUS Interim Accounting function to our UI. Interim accounting allows the AP to periodically send updates to the RADIUS server about the users session. When configuring an 802.1X WLAN with a RADIUS accounting server, enable Interim Accounting and set the frequency for which interim accounting updates should be reported – set your interim accounting interval to be between 60 to 600. With Interim Accounting disabled, you will continue to use the value specified in the Access-Accept request from RADIUS Server.
Find this configuration in the Network > WLANs > Select a WLAN page when creating a 802.1X WLAN.
Wired Assurance
Switch port bulk actions
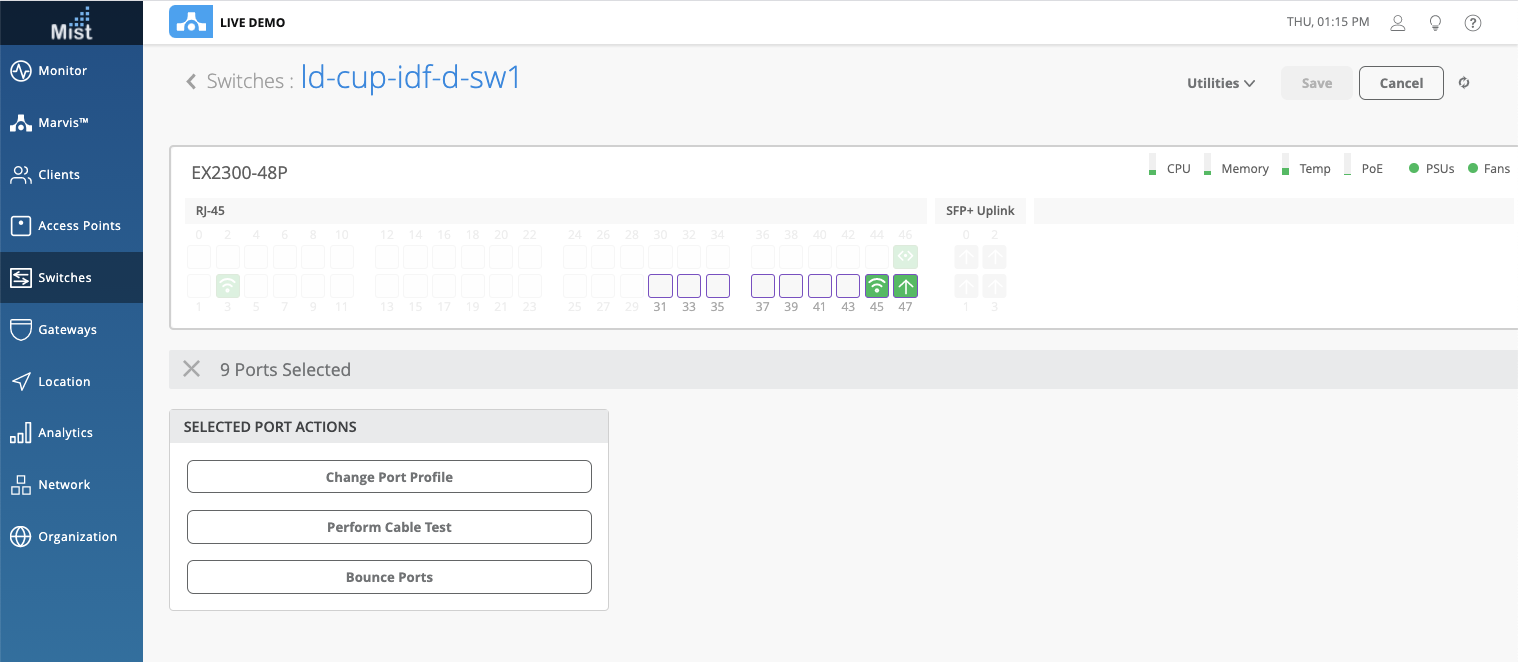
We are enhancing our features with the switch port front panel UI with the introduction of bulk actions for ports. In your Switch details page (Switches > Select a switch), you may select multiple ports on the switch map to perform a bulk action. These include:
- Changing the port profile
- Performing a cable test
- Bouncing the ports
You may choose any port on your switch regardless of what is connected to it. Just click on the switch port front panel to select your desired ports to perform actions on.
Features moving to GA
We are pleased to announce the migration of multiple Beta features into our generally available release. Starting this week, the following features will be available to all users, without the need for a specific tag:
Occupancy Analytics
Using the zones you set up in Location Live View, you can now set a limit for the number of clients allowed in each area on your map. Use this analytics page to see which areas in your site get overcrowded and enforce capacity limits for each of your Zones. This may be helpful for locations where there are restrictions on the maximum capacity. You may also use this to help with adhering to social distancing protocols within your site and have a better visual for proximity tracing efforts.
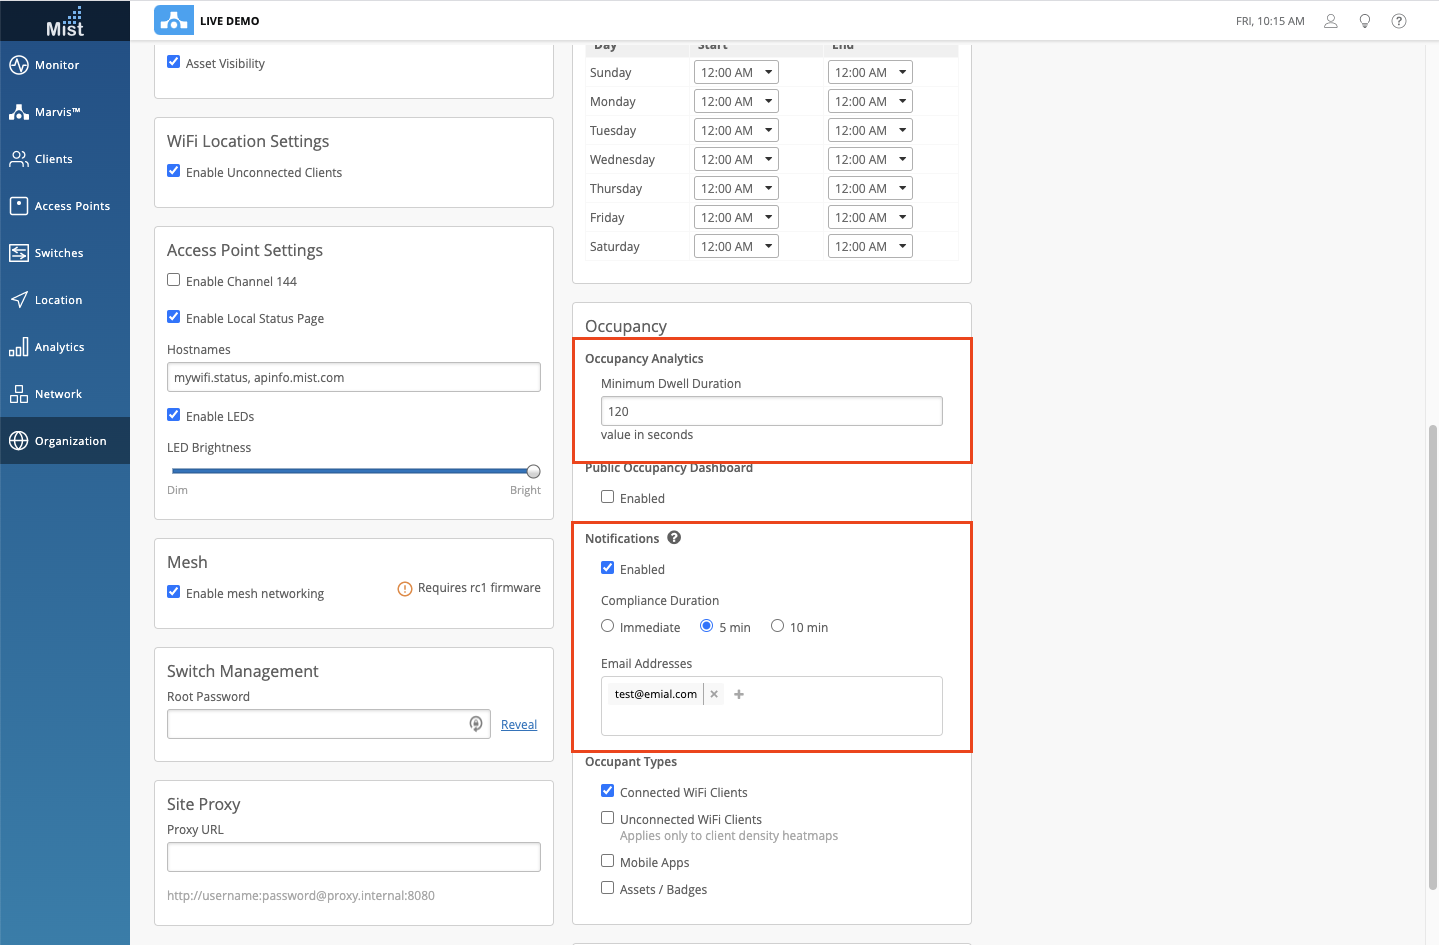
To configure Occupancy Analytics settings, navigate to Organization > Site Configuration and find the Occupancy section to make your configurations. Here, you may set the minimum dwell duration for clients before they are counted towards the capacity, and enable your notification settings.
View the Occupancy Analytics page on the Mist dashboard in Analytics > Occupancy Analytics
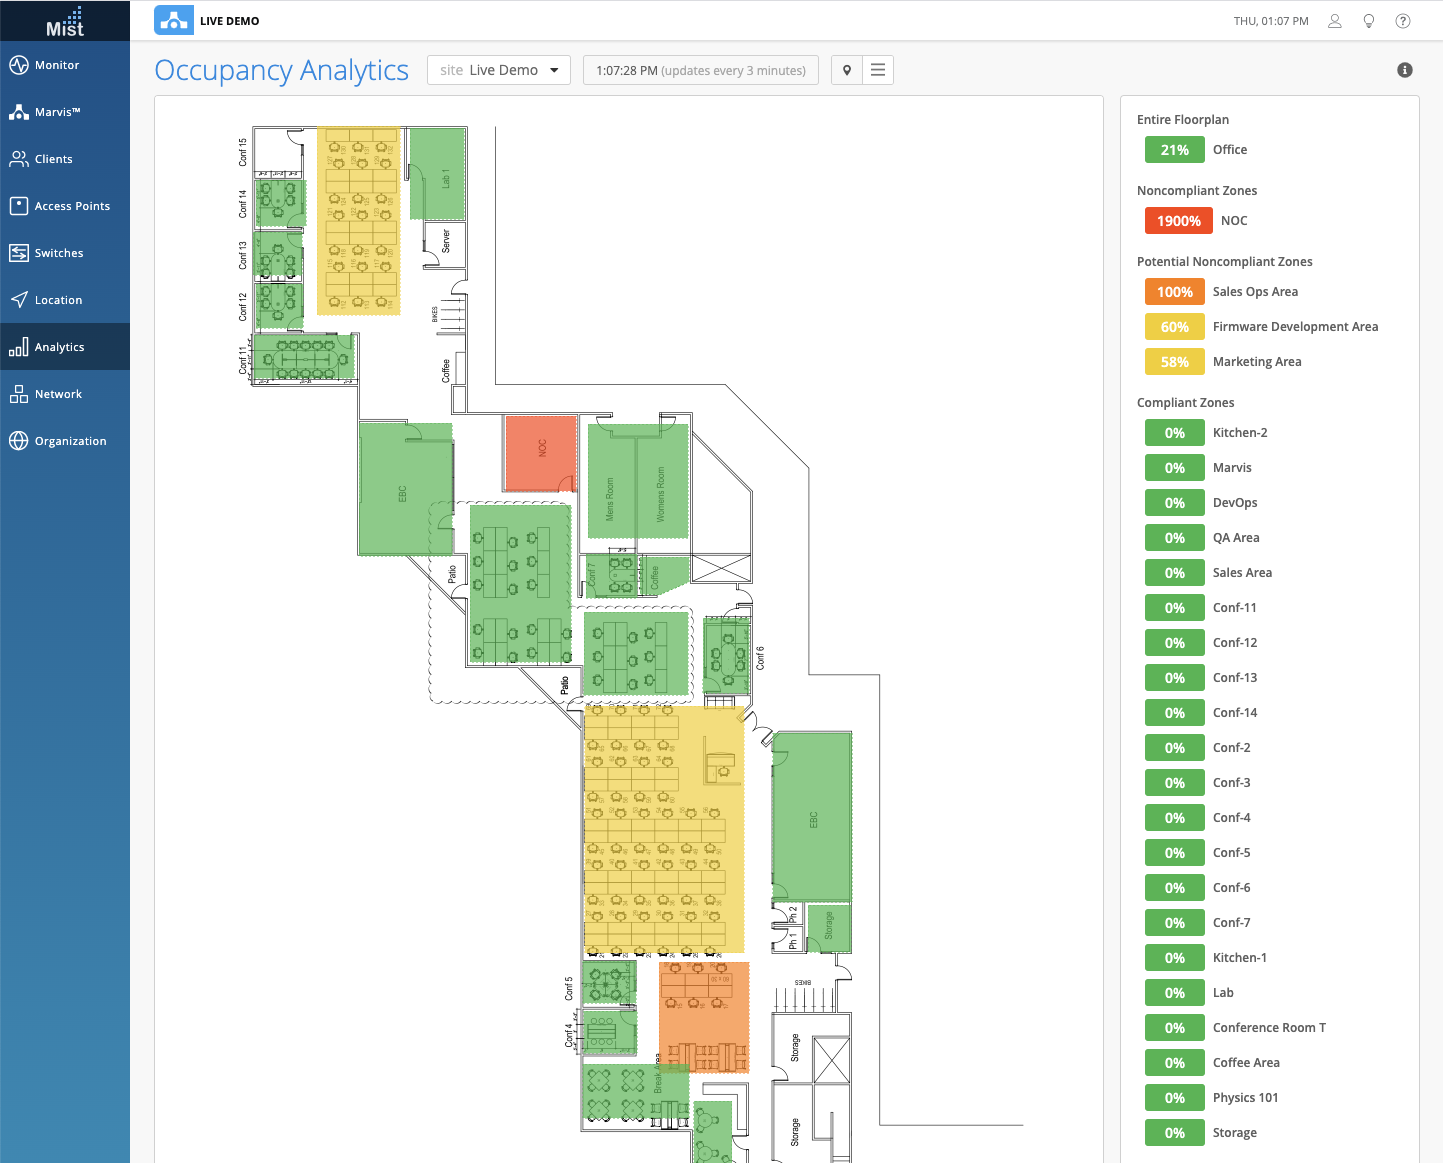
To get started, make sure you have zones set up in the Location Live View page. To see more details on how to set up zones in your site map, please visit this documentation page: https://www.mist.com/documentation/zones/
Alerts
The Alerts page on the Mist dashboard helps you maintain full and constant visibility across your sites. Here, you may view the full list of alerts detected on your site. You may also configure alerts to receive Email notifications for certain types of events detected on your network.
To configure your Alert Template, navigate to Monitor > Alerts and select Alerts Configuration. Click on Create Template to get started with a new template.
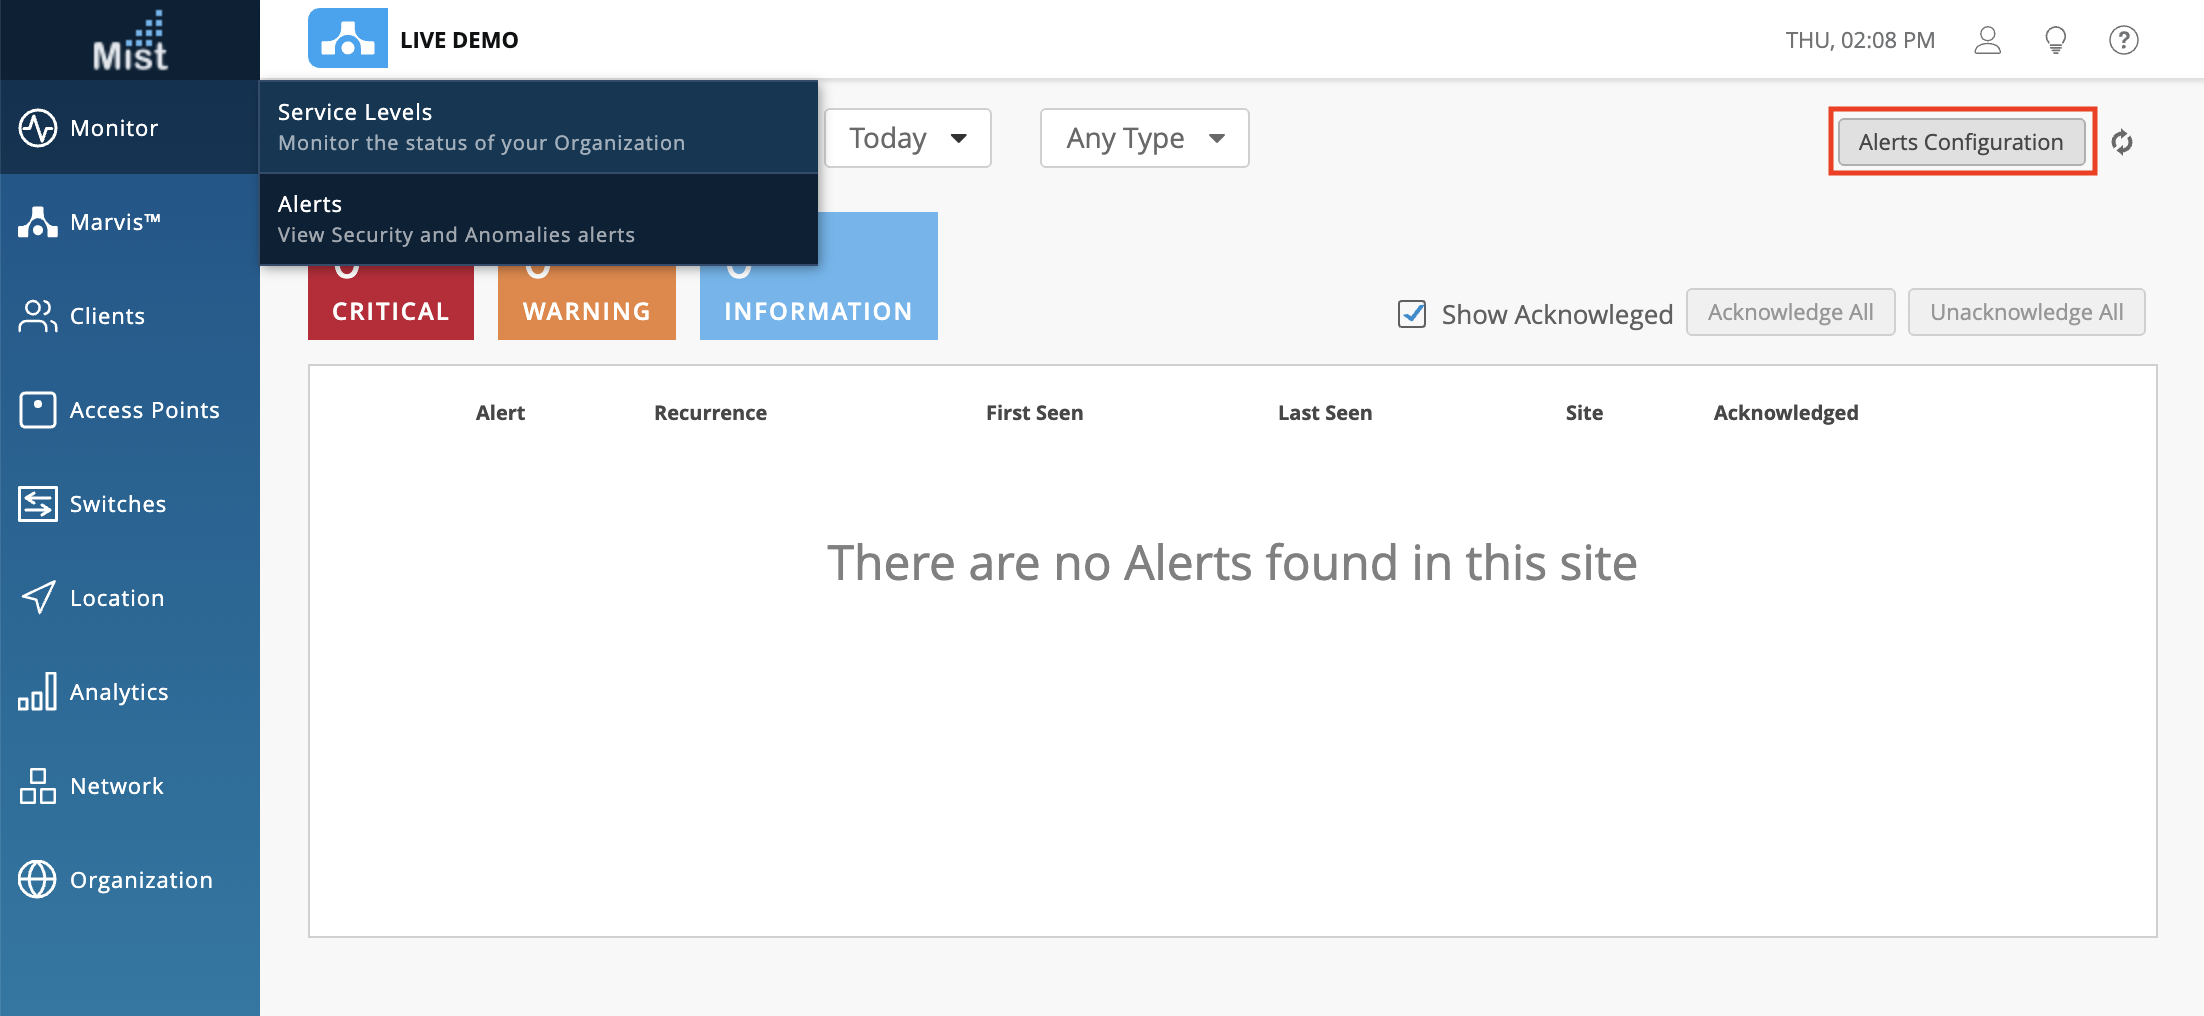
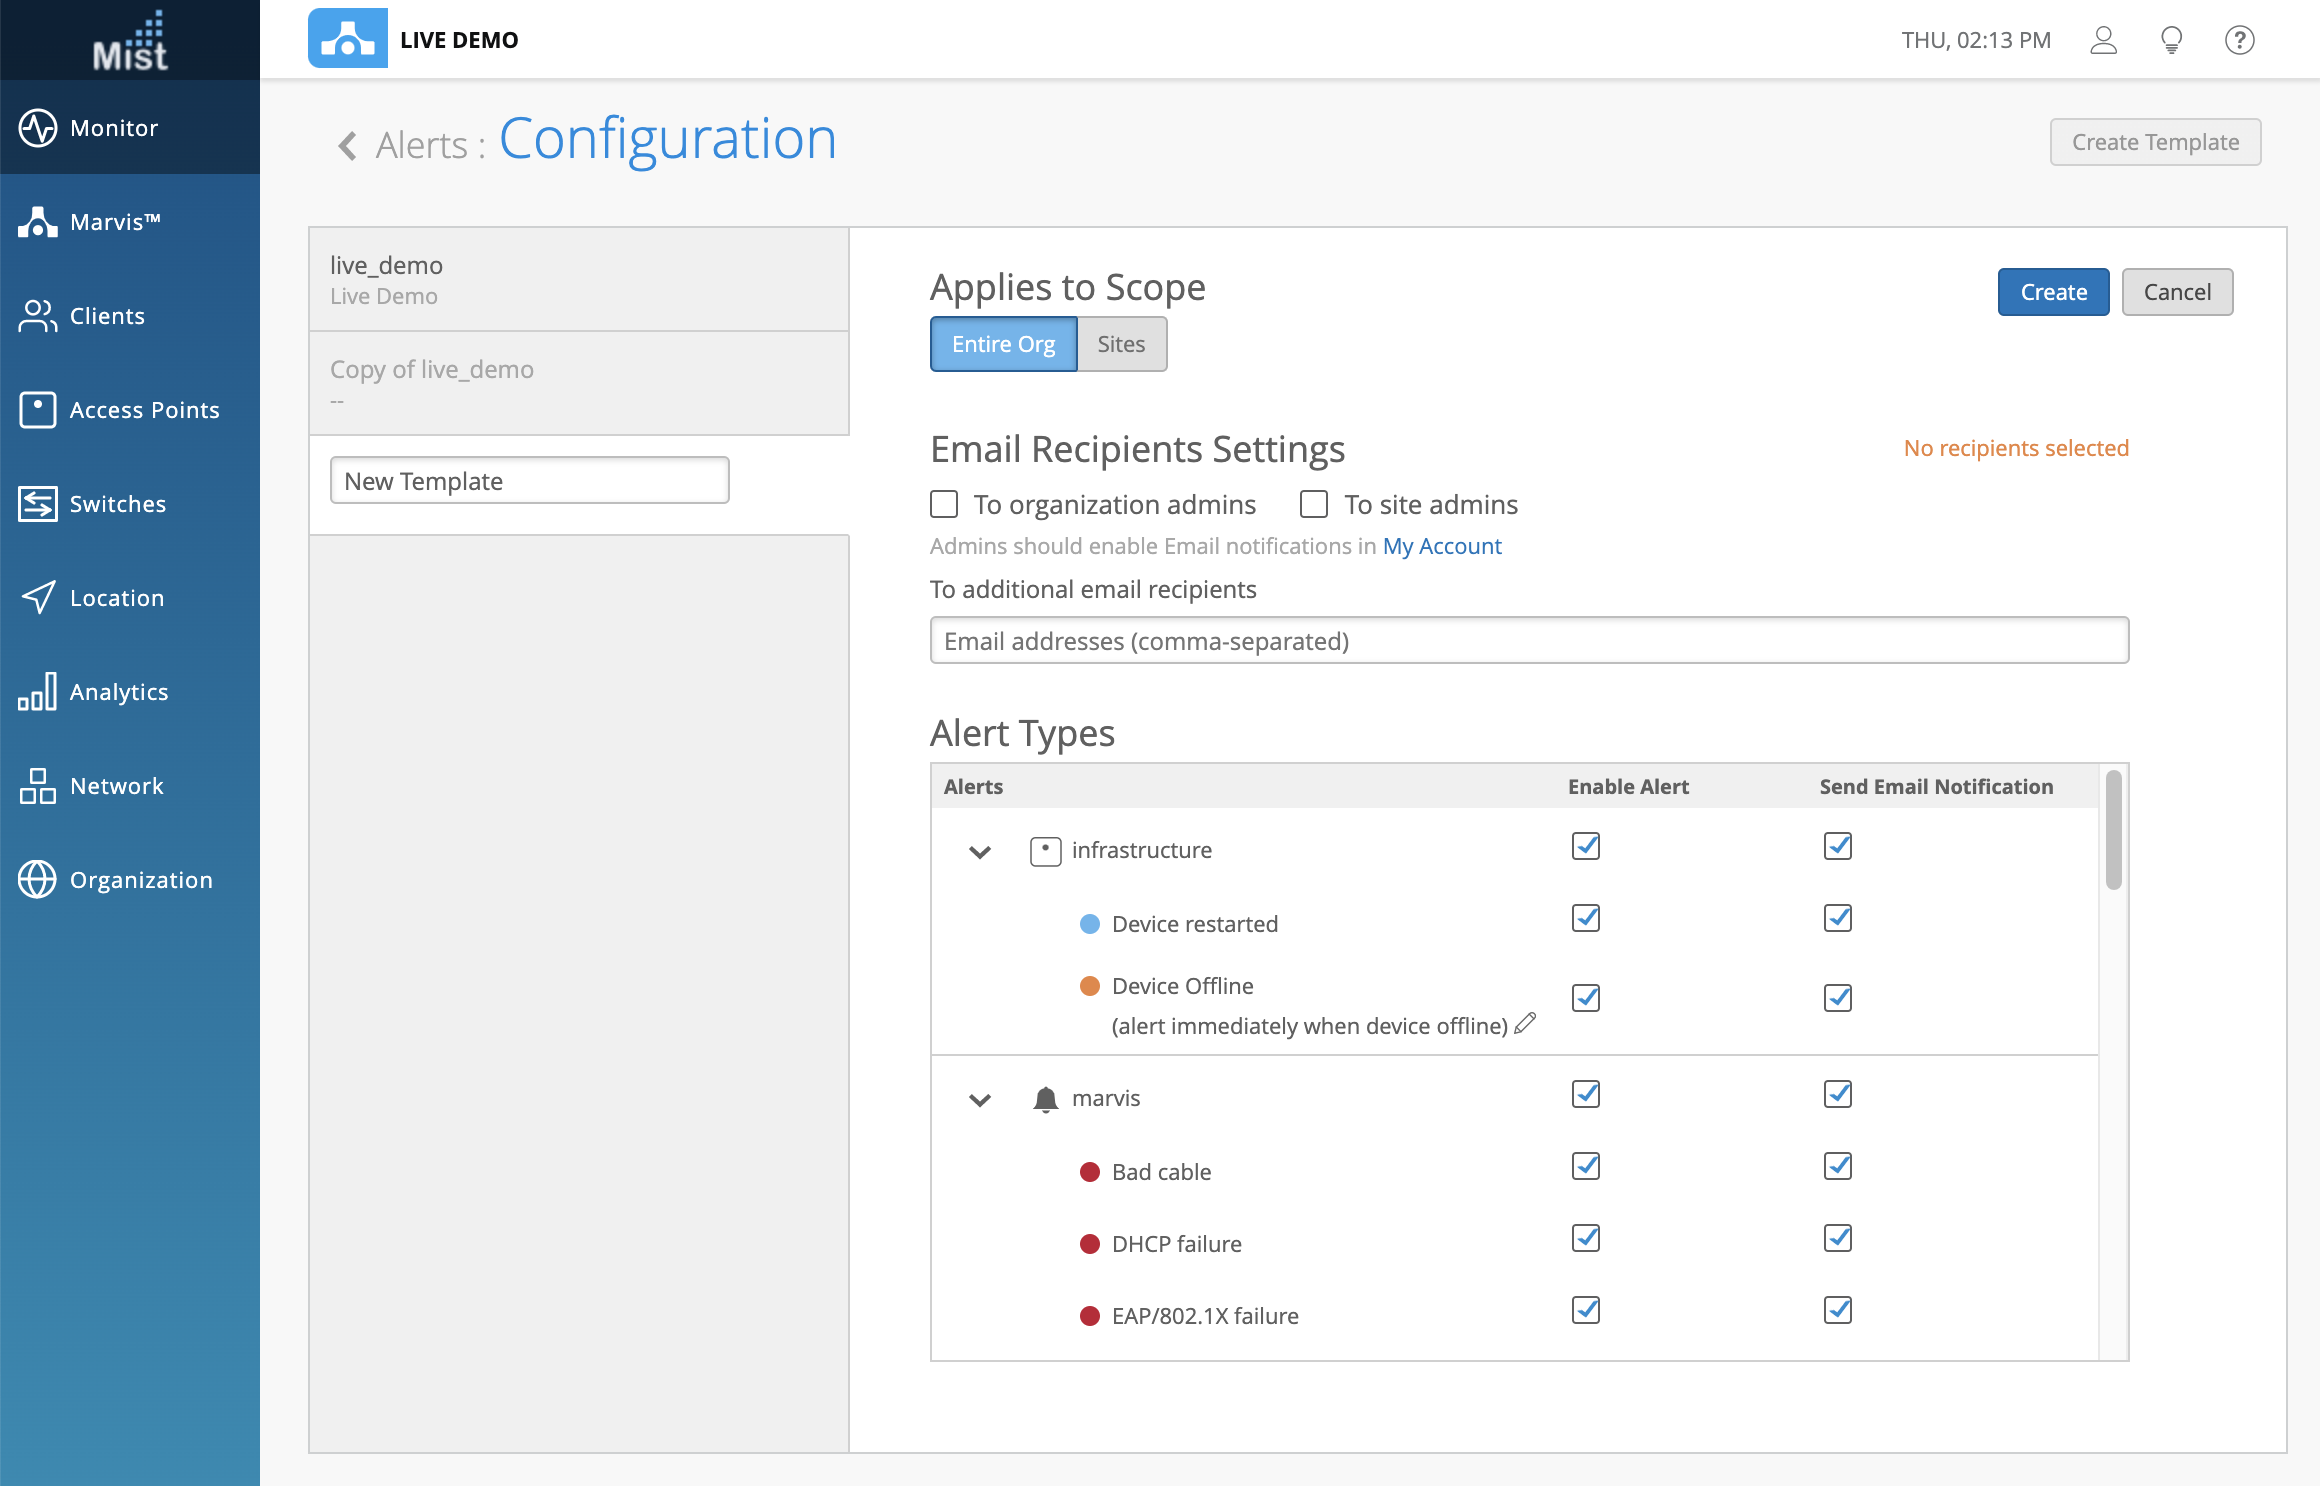
Choose the scope of your template to include either the entire org or limited to certain sites. Then, specify who will be receiving Email alerts – either all organization admins, all site admins, or a list of Emails which you may provide.
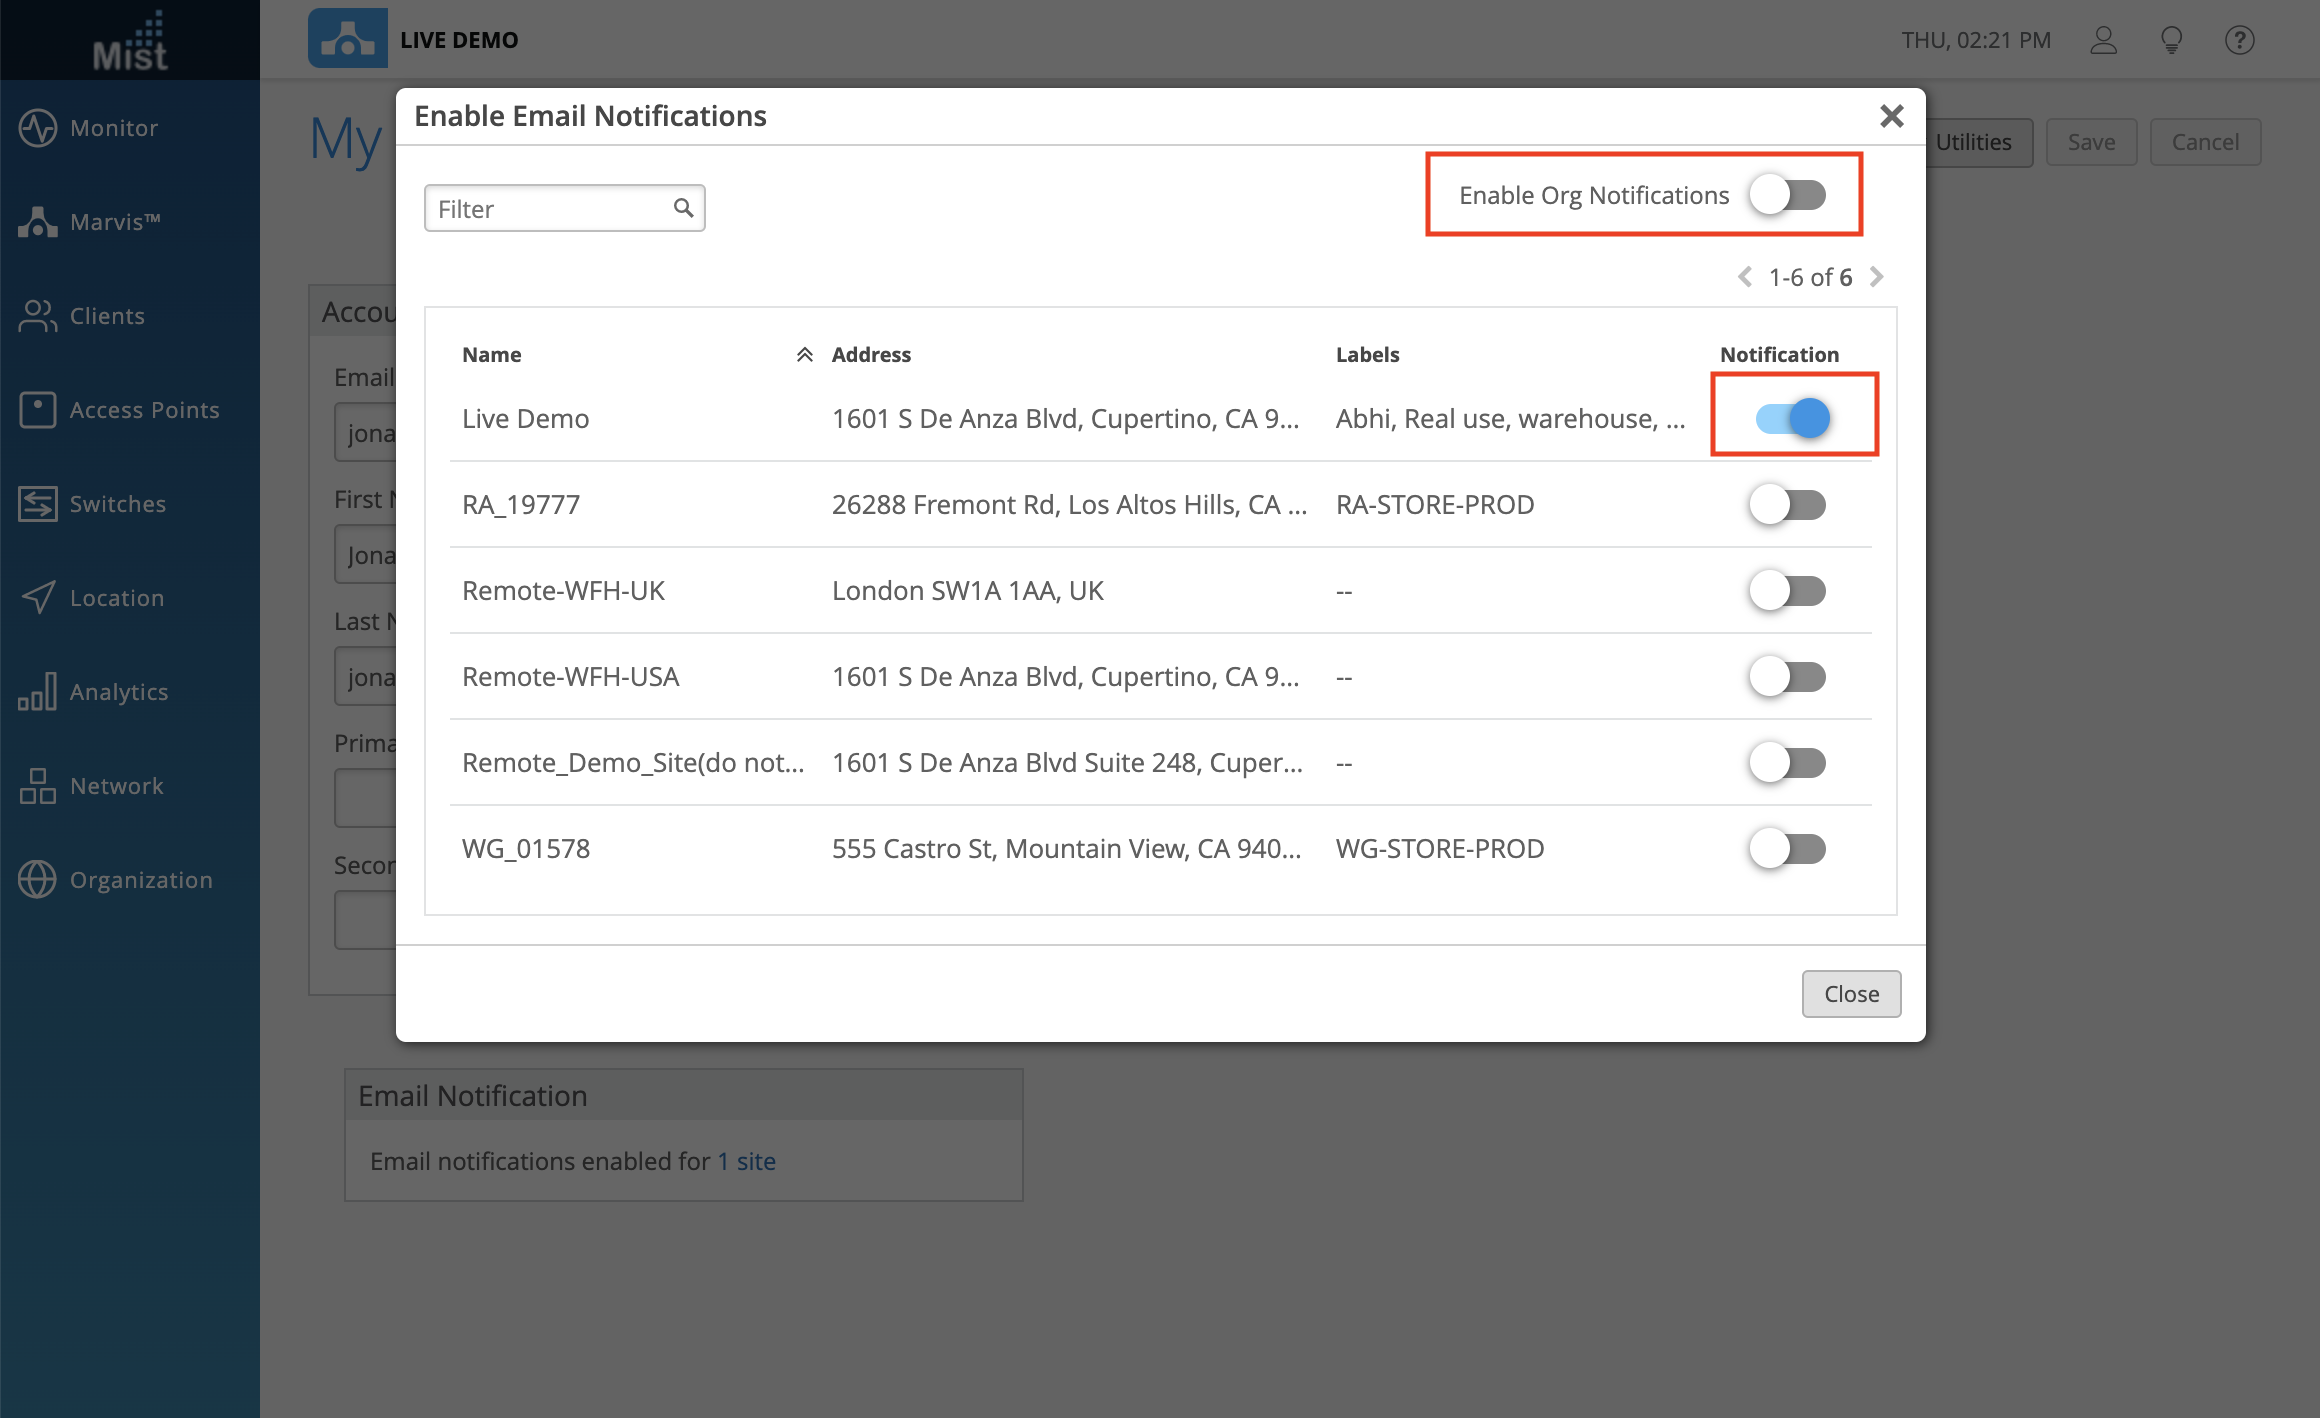
Please note that admins who wish to receive Email alerts need to individually enable Email notifications on their own Account settings page ( 
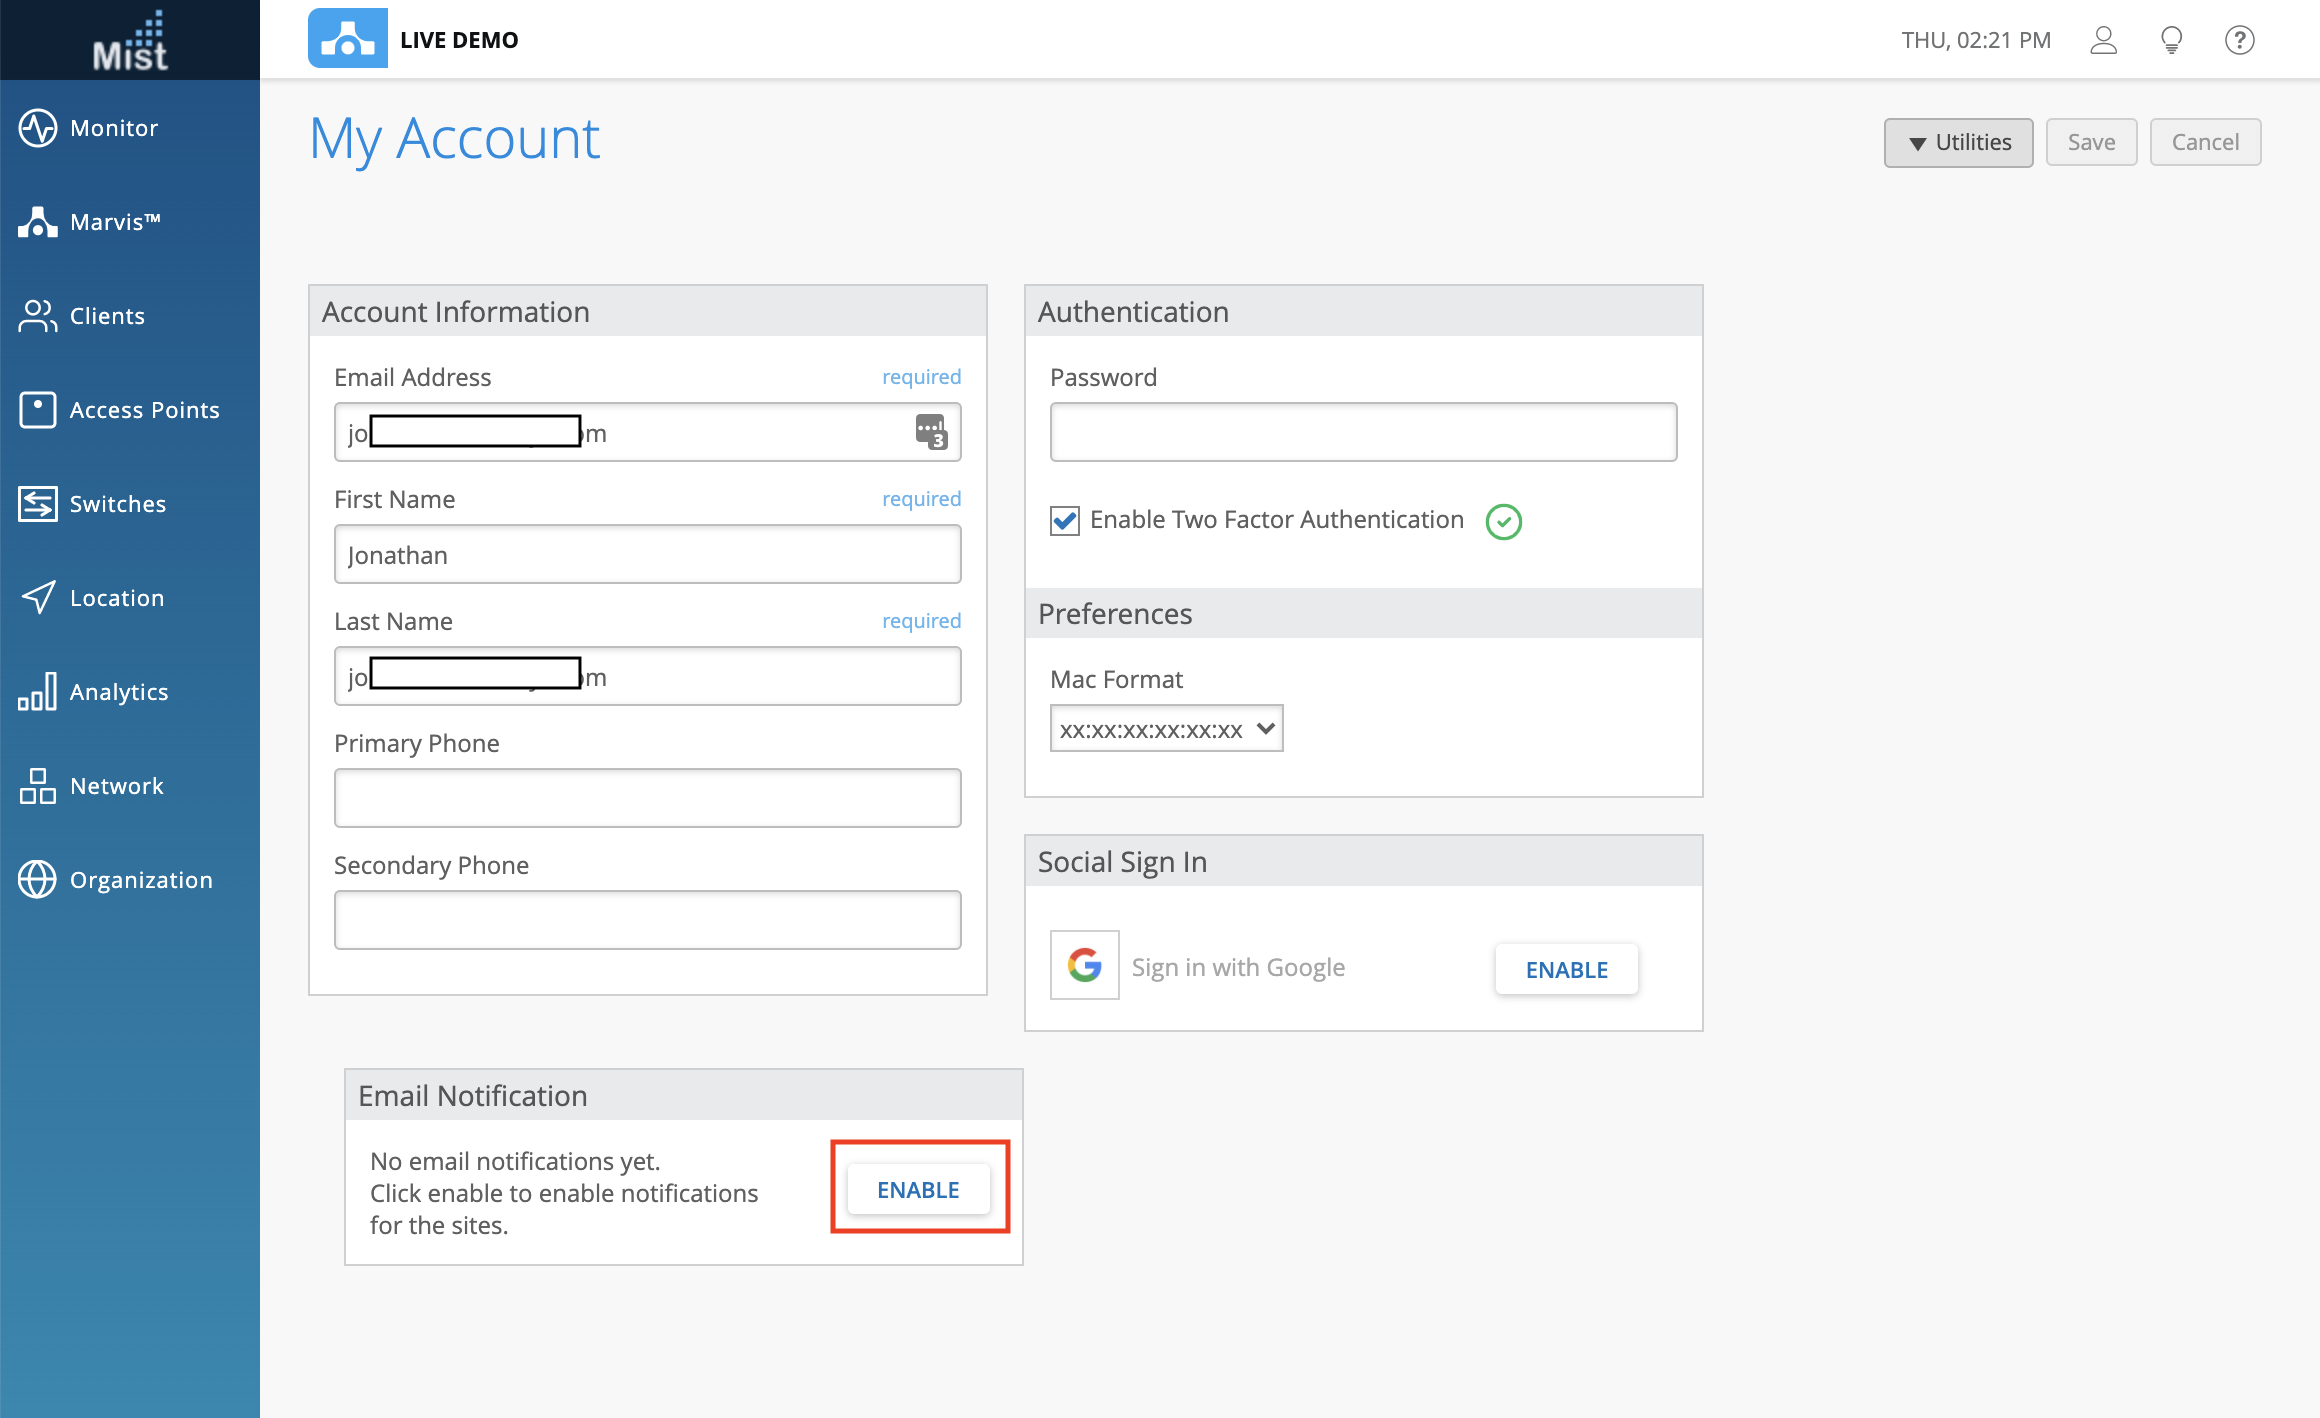
Either enable Email alerts for specific sites, or enable Org wide Email alerts
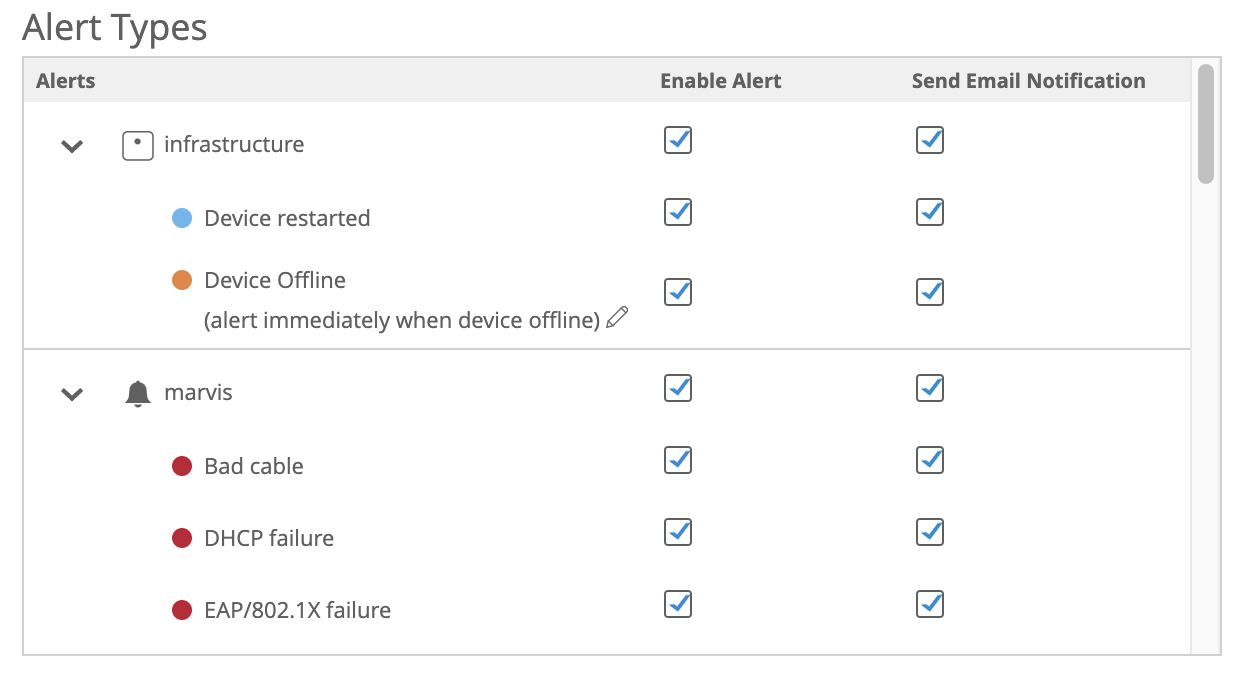
Next, on your Alert template you may choose the alert types you wish to monitor. By default all alerts are enabled and will send an Email notification. Enabled alerts without Email notifications will still be visible in your Alerts page when they are generated. Currently we generate alerts for Infrastructure, Marvis Events, and Security.
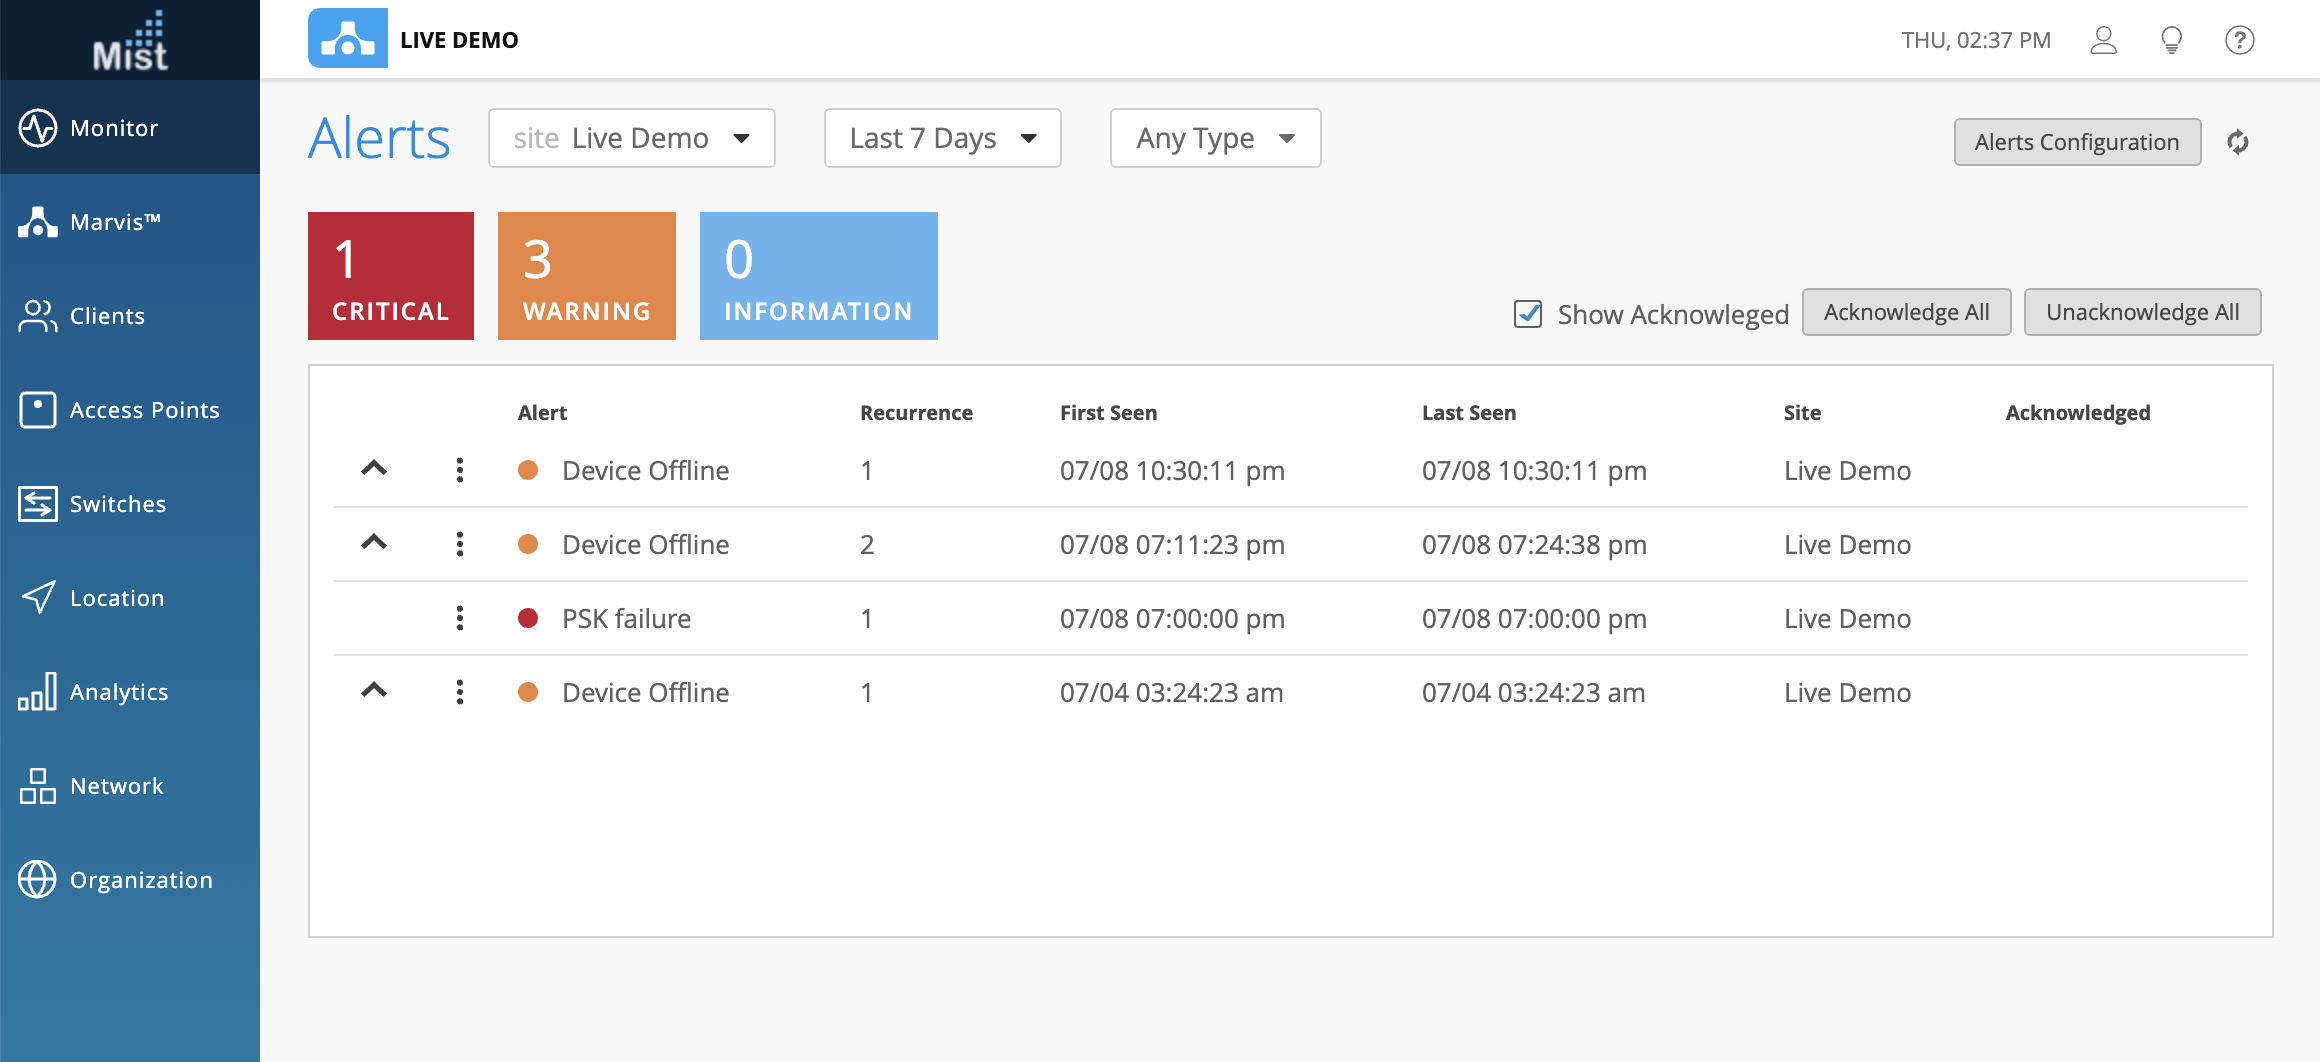
On the Alerts page you will see the list of alerts in your chosen timespan. The degree of importance is indicated by color (red=critical, orange=warning, blue=information). Filter by each type by clicking on the colored squares. Here, we can see that the PSK failure causing an anomaly is marked as critical, while the Device Offline events are categorized as a warning.
