We at Mist are constantly working on making the Mist experience the best possible experience. So every week you will see new and updated cloud features. Here are the updates for June 7th, 2018.
Marvis
Mist is proud to introduce the first ever virtual assistant for troubleshooting network issues. This AI-driven assistant accepts commands in either Natural Language or Guided Queries to provide insight into how your network is operating and being used. With Natural Language Processing, Marvis can easily understand commands written in a natural language format, eliminating the need to memorize selective commands. The Guided Query option can also be used when you want to have a more comprehensive view of all available commands accepted.
Marvis is built upon Mist’s AI engine and leverages our rich insights and data science toolkit in order to comb through the 140+ client states to make accurate conclusions of the root cause and scope of impact when issues happen. By using this “Alexa” for IT tool, you will save time and energy otherwise used trying to pinpoint the exact cause of your network problems. The virtual assistant allows users of any background, from amateurs to seasoned networking experts to fully utilize the tool and analyze areas of impact on your network.
Bayesian Inference Analysis
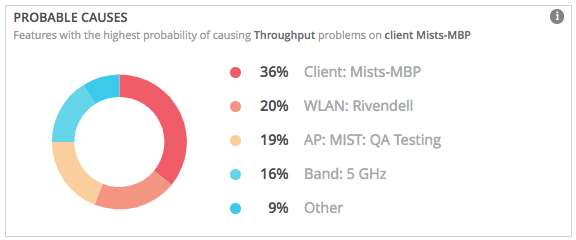
Using Bayesian Inference Analysis, we are able to determine the probability of cause, identifying if a client, radio band, WLAN, or AP is most likely the reason for failure. This chart is shown as part of the correlation section, called Probable Causes.
Mutual Information
Taking data from all Clients, WLANs, radio bands, APs, Operating Systems, and client types, we compare our client to all other clients on the site. Using this data, you can see what factors are correlated to network problems. For example, if every client on a specific WLAN is having issues, that WLAN will show up as a red bar, implying a negative correlation to the other WLANs. A blue bar means a positive correlation (mostly good events). Read more about Mutual Information and how the Pearson Correlation is used to calculate predictions here: https://www.mist.com/building-blocks-ai-mutual-information-pearson-correlation/
Use Case
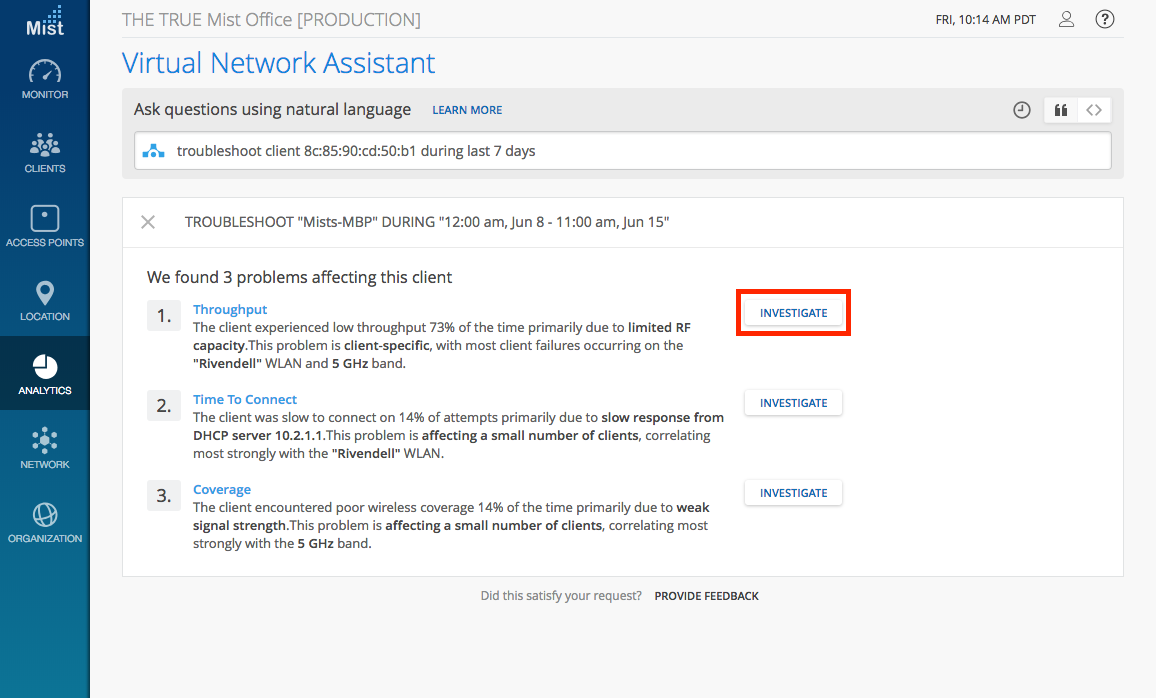
To use Marvis, navigate to Analytics > Virtual Assistant. Use either natural language mode or guided query mode to type in your command. Toggle between the 2 modes using the buttons on the upper-right hand corner.

Here are some popular queries to troubleshoot your client:
- Troubleshoot client iPhone32 during this week
- Investigate client iPhone32 from 8:00 AM – 10:00 AM, Jan 13
- How is client b8-27-a3-25-0f-e8 today
- List events for client JennyLaptop
- What is wrong with client b8:27:a3:25:0f:e8
See this page for more queries accepted by Marvis:
https://manage.mist.com/admin/vnadocs.html
Natural language mode
Guided Query mode
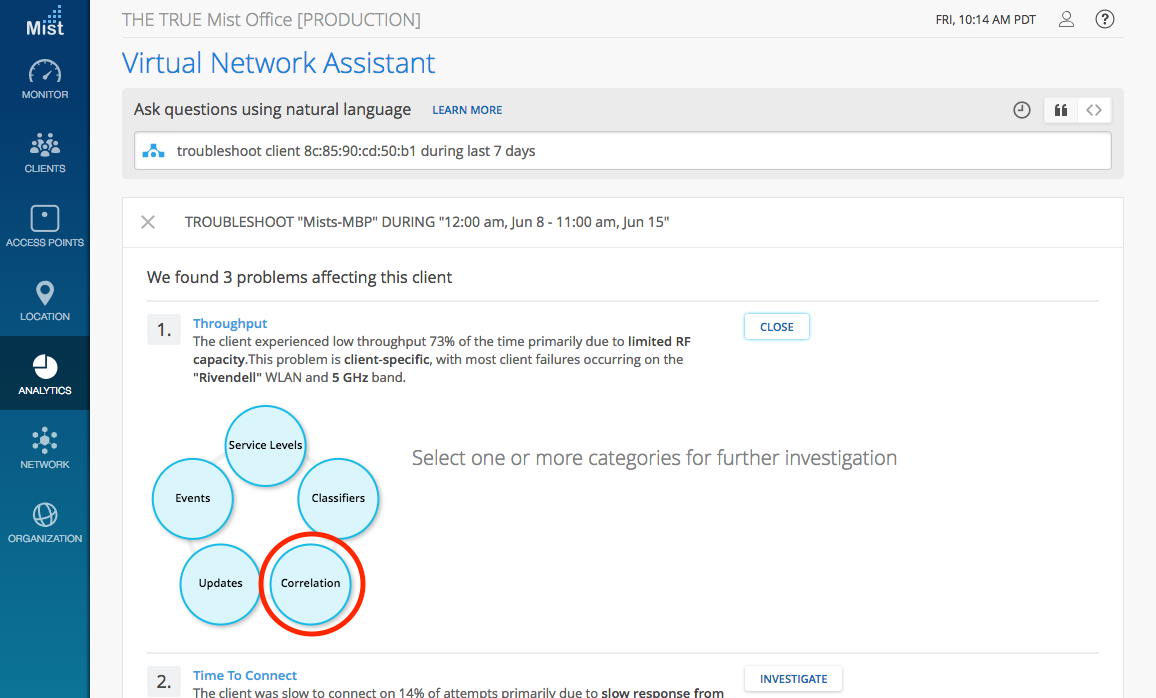
Select Investigate on the SLE you want to troubleshoot, which reveals options to look into.
To access the Bayesian Inference Analysis and Mutual information charts, please select Correlation. The correlation section is divided into two parts: Probable Causes (Bayesian Inference Analysis), and Scope of Impact (Mutual Information).
The Probable Causes chart gives a probability score to the source of the issue. If no information is given, the default probability will be 25% Client, 25% WLAN, 25% AP, and 25% Band. These values will start to shift from there when more information is available. The purpose of this chart is to determine the most likely cause of failure – it is a good indicator when there is a >5% difference between the highest percentage and the rest. In this example, Marvis tells us that based on all the observations that it had from the network realization, the probability that the issue is caused by the client itself is 36%, followed by a 20% chance of WLAN: Rivendell being an issue.
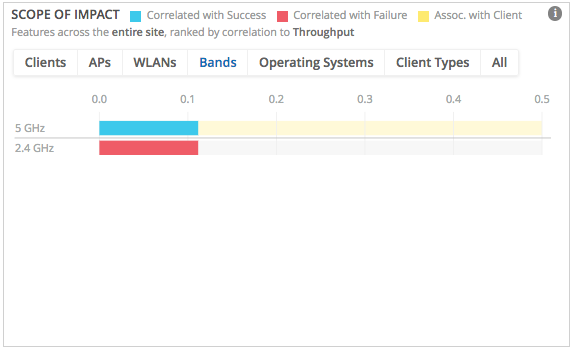
We can look at the Mutual Information below, which is a global display of your site and how items in each category are correlated with one another. The red bars indicate correlation with failure compared to all items in that category, while the blue bars indicate correlation with success; the larger the bar, the greater the correlation. The yellow highlighted bars show what your client is associated with. Click into each section to get a detailed view of the items and correlation.
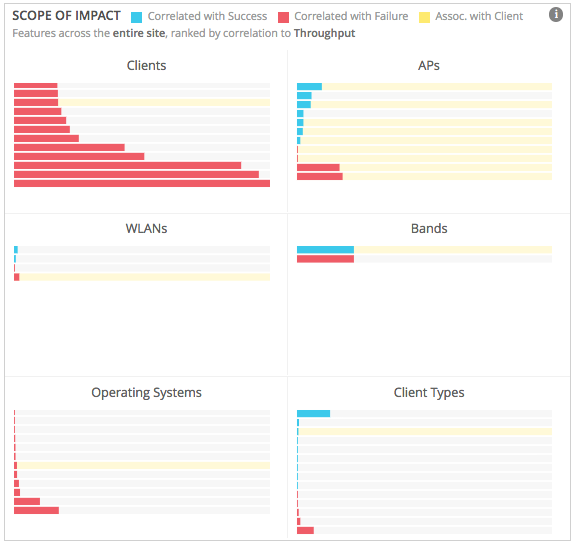
In this example, the client itself is correlated with failures compared to the other clients even though it is not the worst case in the Clients section. Scrolling up in that box, we see that there are many clients correlated with success, so relative to all clients on the site, our client is correlated with failures.
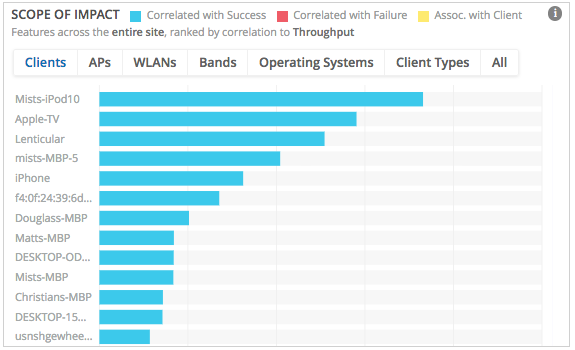
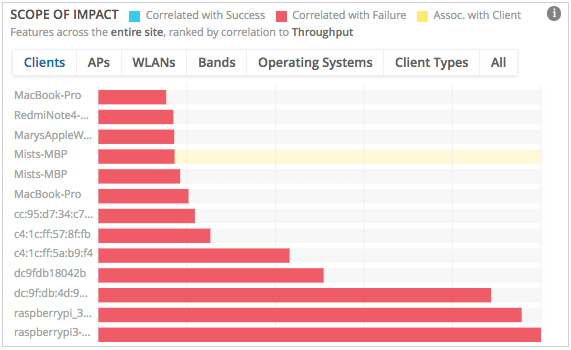
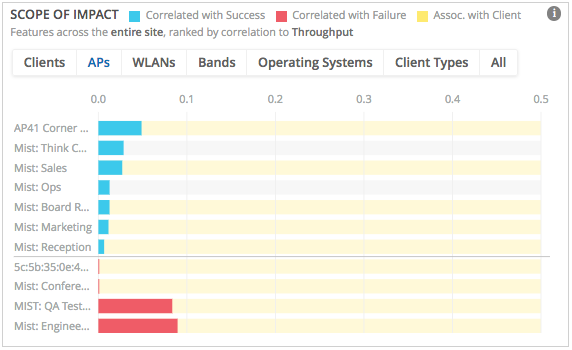
The client has roamed onto several APs (indicated by yellow bars on multiple APs), some correlated with failure and some correlated with success. Therefore, we cannot assume that this is an AP issue. From the Probable Causes chart in the previous section, we know that this client spent the majority of its time on the MIST: QA Testing AP.
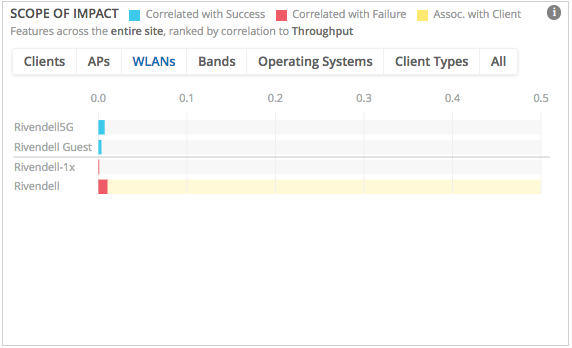
The client did associate to a WLAN which is correlated with failures, but since the red bar is so small, this indicates that the WLAN is not strongly correlated with failures. It’s possible that a couple clients experienced low throughput and they happened to be connected to this WLAN, but there are not enough low throughput cases for this WLAN to be classified as strongly correlated with failures.
The client associated to the 5GHz radio band, but we can see that this band is not correlated with failures. 2.4GHz band is actually the band correlated with failures for throughput issues.
Neither the Client type nor the Operating Systems give us any strong indicators of correlation between success and failures, so we can safely assume that these are not related to the cause of our low throughput.
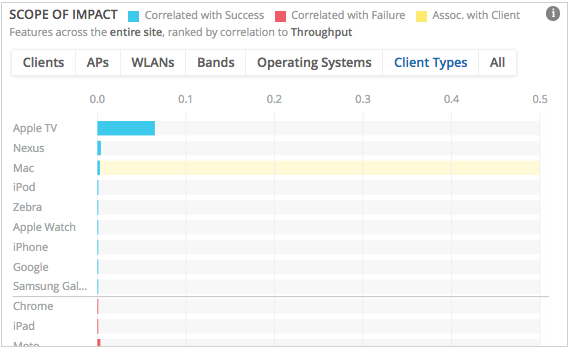
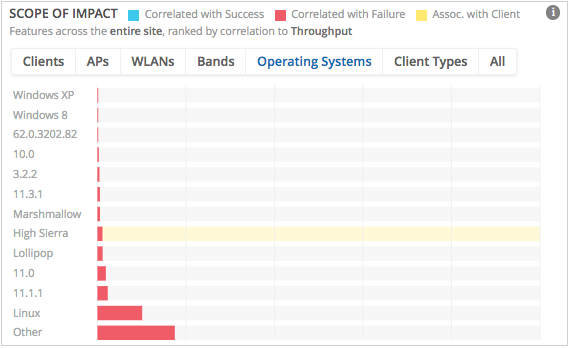
Looking at all of the different categories we come to the conclusion that this is in fact a client-specific issue, as that is the most strongly correlated to failures. The other categories don’t have a strong enough correlation to failure to be identified as the cause of failures.
To learn more about Marvis, please visit the section in our support portal: https://www.mist.com/documentation/category/marvis/
Please note that Marvis is an additional service on top of your standard Mist subscription, and will require further payment. Email support@mist.com for more details or to sign up today.


