Wired Assurance
Option to hide unused networks and port profiles
The switch details page and switch template now provide an option to hide networks and port profiles that are not used in any user-defined configuration. The unused networks and profiles are listed separately and can be collapsed or expanded as required. An unused network refers to a network that is not used in any user-defined port profiles or L3 sub-interfaces. Unused profiles are the port profiles that are not used in any static or dynamic port configurations defined by users. This feature helps you quickly identify those port profiles and networks that are in use and those that are not in use. This feature is particularly useful when you want to modify or delete port profiles or networks.

Dynamic port assignment status on port hover
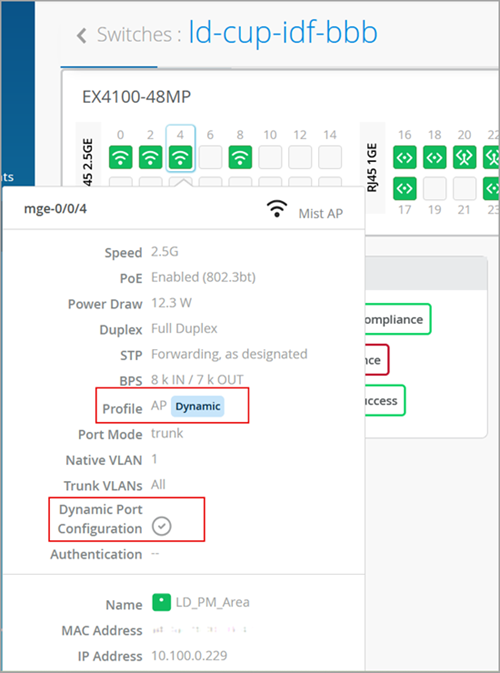
On the front panel on the switch details page, you can view the dynamic port configuration and assignment states for a port by hovering over it.
The hover message shows the label ‘Dynamic’ against the port profile listed if the profile was assigned to the port based on the dynamic port assignment rules configured. The port also shows a check mark against the Dynamic Port Configuration field.

If you enable dynamic configuration on a port, but the dynamic port assignment rules do not find a matching profile to be assigned to the port, the port hover message displays only the Dynamic Port Configuration check mark. It does not display the Dynamic label against the profile.
View the top processes live in a switch
Juniper Mist provides an option to view the top processes running in a switch as part of the CPU utilization data. To view the process details, click View Live Process Detail on the CPU Utilization chart in the Switch Charts section of the Switch Insights page.
The View Live Process Detail button on the Switch Insights page:

The process details view:

Live traffic counters on switch ports
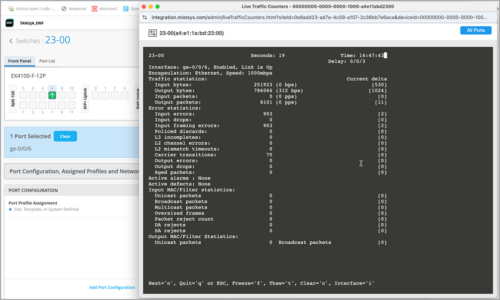
You can now view the live traffic counters for a single port or all the ports on a switch from the switch details page. This feature is helpful for troubleshooting your switch connectivity. To view the traffic counters for a port, select that port from the front panel section of the switch details page and then click Live Traffic Counters.

The data in the traffic counter view includes port status, input packets, output packets, and pps information.

Source IP address on the switch list
The IP Address column on the switch list now shows the source IP address which is used to connect the switch to the Mist cloud. You can also see the source IP address on the Statistics tile of the switch details page.

Last flapped time on the port list
We have added a column named Last Flapped to the Port List on the switch details page to show the time (along with date) at which each port flapped last. You can also find this information in the Switch Ports section on the switch insights page.

The default view of the Port List does not include the Port Flapped column. You need to add it to the view from the list of available columns. To do that, go to Table Settings window by clicking the hamburger menu on the upper right of the page, select the Last Flapped check box, and then close the window.


