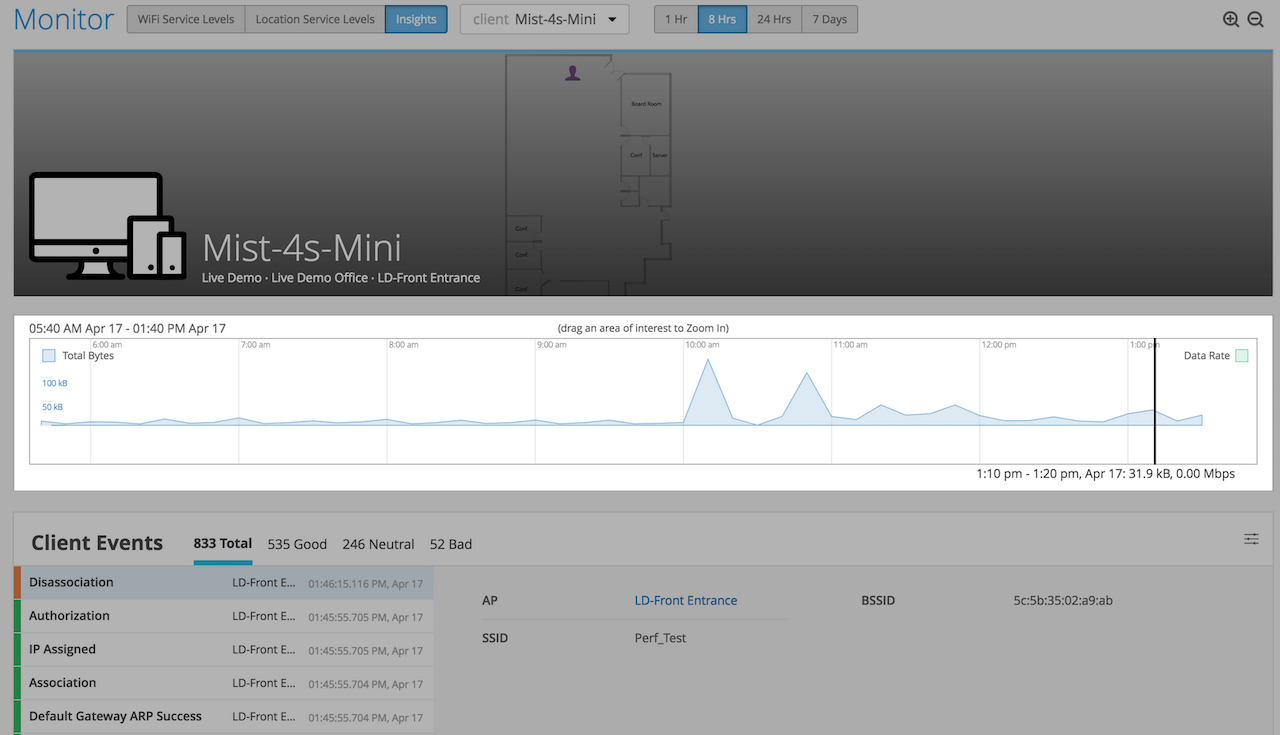
On the top you have a graph, which shows you an overview of the data consumed and any client events are marked in red on the graph.
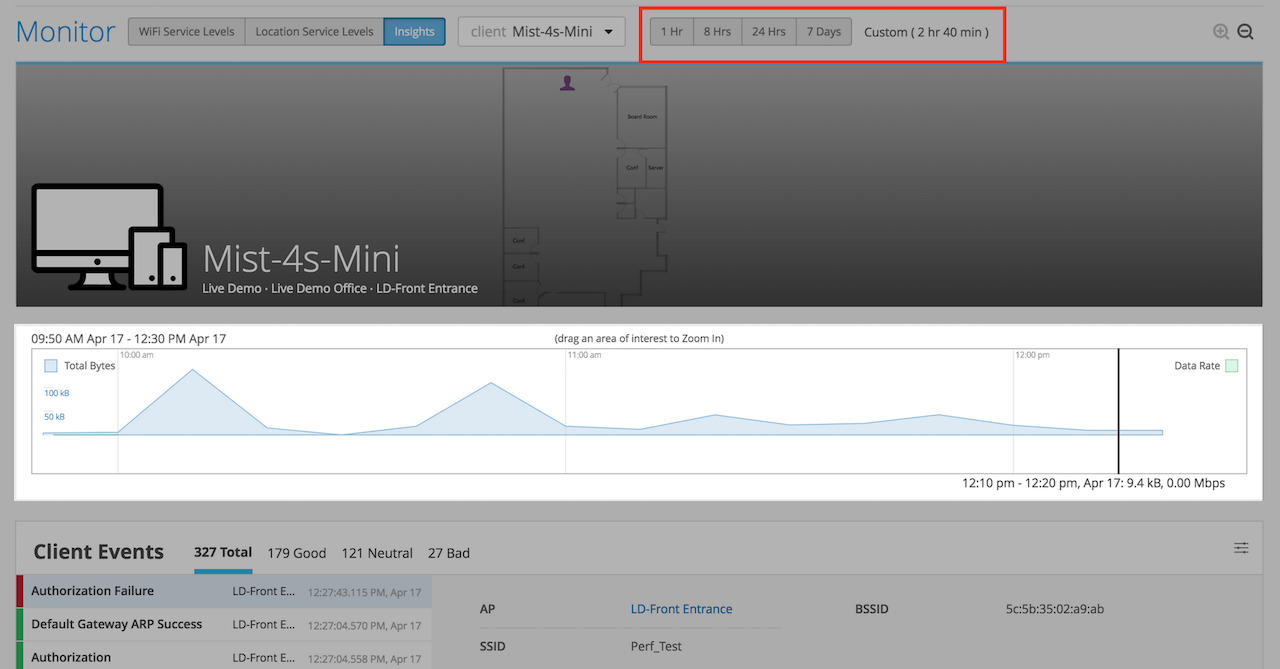
You can also drag and highlight a time period for which you want insights for specifically.
Below the graph, you have the Client Events section.
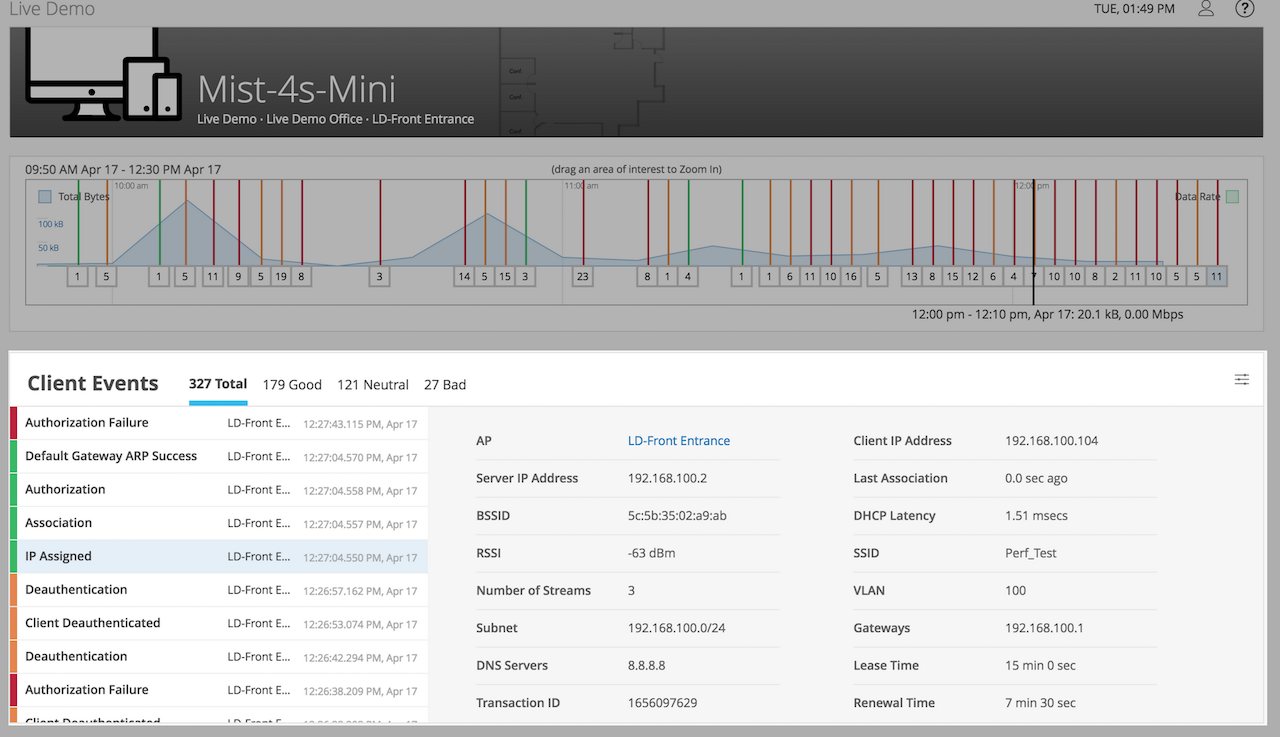
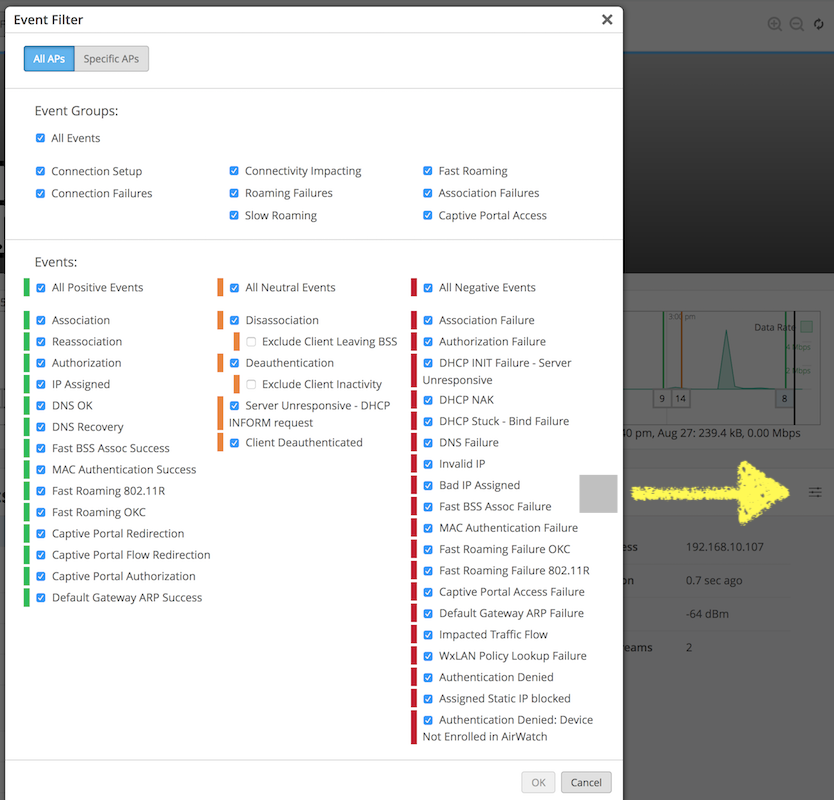
The specific client events can be seen/selected clicking the ‘hamburger’ icon showed below. This really shows the granularity possible with the Mist solution. This will be added to over time.
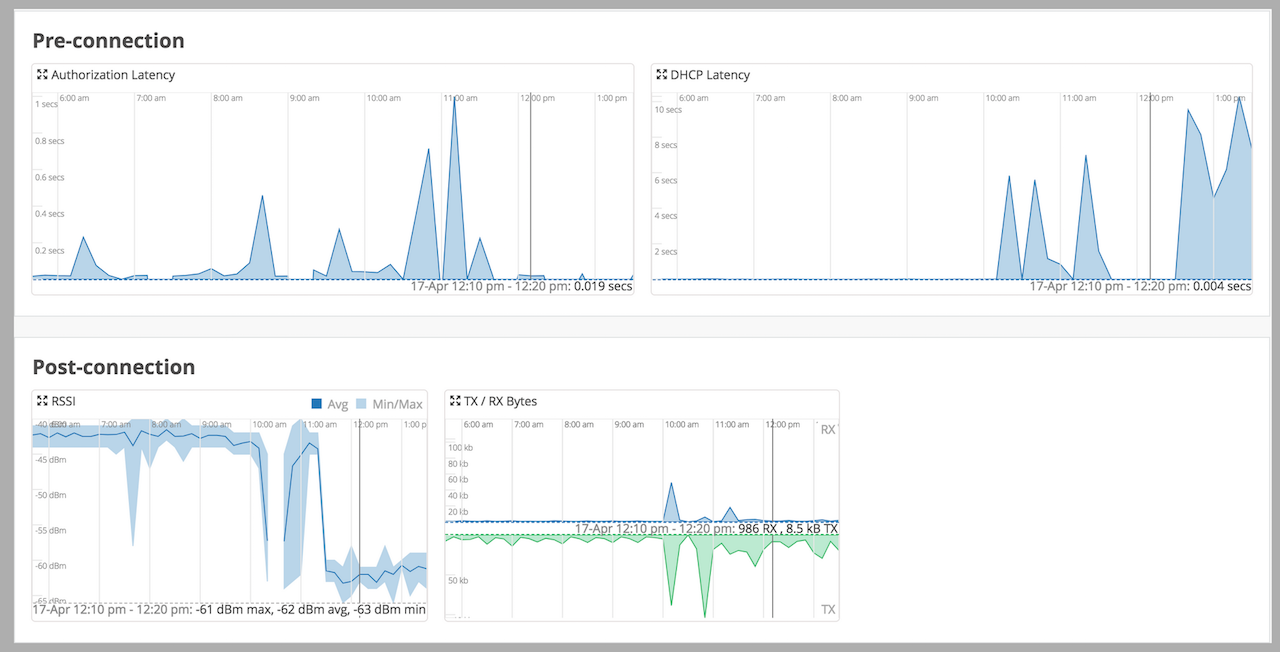
You can scroll down to see other Pre Connection and RF details for the client.
